Post written by Pamilla Kang.
Data is an undeniable part of modern society. Perhaps surprisingly, an incredible amount of data is collected about our daily lives and the communities in which we live. This data has the potential to shape policy-making, funding and target services, but can be inaccessible and difficult to understand. Open Data Manchester (ODM) is just one of many organizations that aims to build public understanding of data, and opening datasets is one way in which ODM achieves this.
One such dataset contains information about the political affiliation of elected councillors in England, and the corresponding deprivation of the areas in which they have been elected. Open Data Manchester first created this database in April 2018 [1], to find and visualise any correlation between relative deprivation and the political parties of local councillors.
At a time where we only really hear about Parliament’s influence on the country, this data alternatively allows a deeper understanding into the slightly forgotten local government. However, since councillors change often with elections and retirements, this is a dataset that requires updating and modifying periodically. Creating a method that automatically updates the database is therefore of great worth, and required development of code in Python to automate the process.
Administrative Geography
While councillors are elected to areas called electoral wards, census data is provided for Output Areas. Output areas were created to have similar population sizes, and Lower Level Super Output Areas (LSOAs) are built from Output Areas with populations of 1,000 to 3,000 people. The Department for Communities and Local Government ranks the 32,844 LSOAs by deprivation in the 2015 Indices of Multiple Deprivation, with 1 being the most deprived [2]. The data is based on a total of 37 deprivation indicators in the domains of income, employment and crime, amongst others. The IMD has been referred to as a ‘billion-pound dataset’ [3], as it is used by both national and local organisations to help allocate funding or target resources, with a focus on the most deprived areas in England.
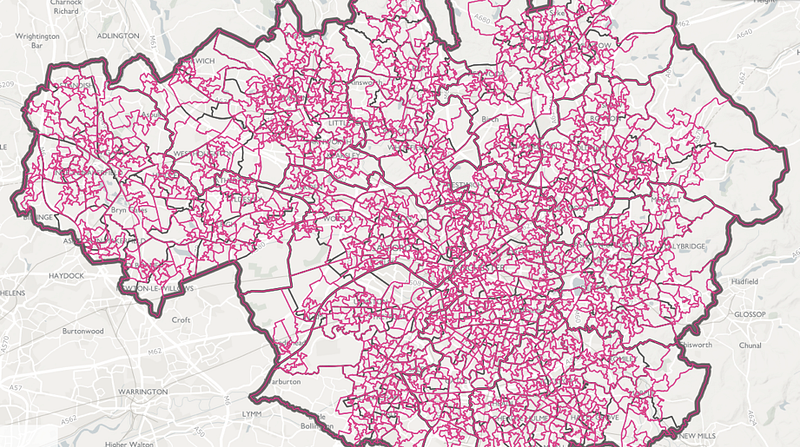
LSOAs for the most part, do not perfectly fit into electoral wards, but the Office for National Statistics, helpfully, released the conversion between LSOAs and 2018 electoral wards in August 2018 [5]. This data can therefore be used to relate the relative deprivation score of each LSOA, to electoral wards and their councillors. As far as we know, there is no other database that links LSOAs with census data to political affiliation of councillors in local government.
Building the dataset
The task of updating the dataset consisted mainly of creating a web scraper in Python, to extract the councillor information from Local Authority District websites. Since clicking on each website and looking for each councillor manually is a time costly method, it was important that the web scraper accounted for as many as the 326 Local Authority Districts as possible. In the end, the code scraped about 200 websites in a single script. However, not all information could be web scraped, which is the biggest limitation in building this database. This is because councillor information is given in a variety of formats — sometimes in downloadable pdfs, other times in a format that requires searching each councillor individually.

One example of a particularly difficult website gave the political parties of councillors as part of a line in the councillor’s office street address, and nowhere else. This is admittedly a very strange way to provide this information, but often it was poor web design that made scraping the information impractical.
Although creating one script that scraped hundreds of websites at once was a large task, it is incredibly useful to have this code so that it can be used again to obtain most of the data in the future. Also, since the code scraped the exact text on the websites, the final database gives the exact political affiliation of councillors, rather than abbreviating their representation to ‘L’ for Labour or ‘Other’ for independent groups etc as the old database did. This means the database contains all elected political parties in local government. In some cases however, councillors do not associate themselves to a political party, and the database reads ‘Not specified’. Occasionally a ‘Not specified’ councillor’s information can be found elsewhere, but in general, these councillors are genuinely not associated with a party.
As well as giving each councillor’s political party, the database also contains the overall representation of the councillors for each ward. To calculate this, councillors that gave two political parties as their representation were assumed to vote with the larger party e.g. ‘Labour & Co-operative’ were considered overall ‘Labour’. The overall representation is useful since it allows each ward to be represented by one of either ‘Labour’, ‘Conservative’, ‘Liberal Democrat’, ‘Green’, ‘UKIP’, ‘NOC’ (no overall control) and ‘Other’ (all other parties). This information can be used to create visualisations of the political representation of each ward.
After obtaining all electoral wards and their councillors, it was possible to merge this with the ONS data which gave LSOAs and electoral wards. This may seem like an easy task, but as it turns out, it wasn’t completely simple. Surprisingly, several wards are spelt incorrectly on their website, which made it impossible to match them up with the ONS data. These wards therefore had to be identified and transferred onto the final database manually. Emailing each district to let them know their ward was spelt wrong was also slightly tempting.
With the LSOAs, electoral wards and their councillors matched up, the deprivation score for each LSOA was added on to complete the database.
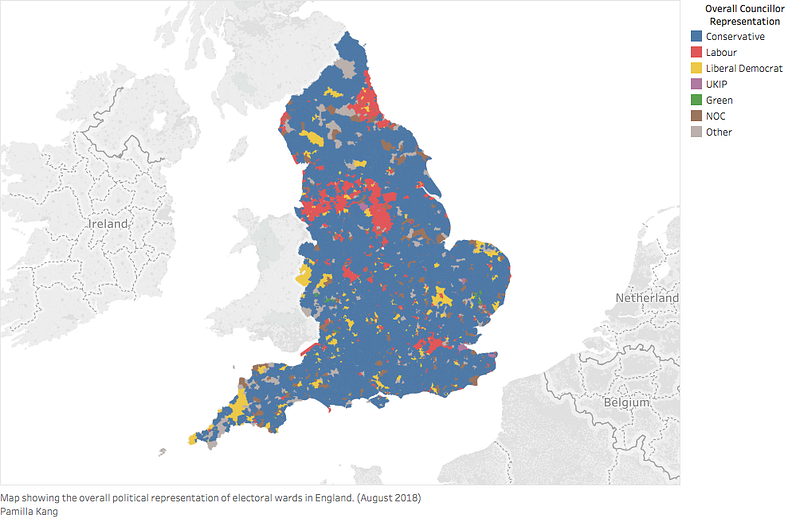
The map of overall political representation is not a visualisation that is usually used for local government and shows some interesting patterns, but it fails to capture any correlation between deprivation and local government representation. The database will be used in the future to update the Deprivation vs Political Control visualisation created by ODM in April 2018. The database is also available on ODM’s GitHub [7], including a link to the various Python codes used to build the database [8].
[1]https://medium.com/@opendatamcr/deprivation-vs-representation-building-a-dataset-eea715a87e25
[2]https://assets.publishing.service.gov.uk/government/uploads/system/uploads/attachment_data/file/465791/English_Indices_of_Deprivation_2015_-_Statistical_Release.pdf
[3]https://youtu.be/6U5U01CE_fI
[4]https://mappinggm.org.uk/gmodin/?lyrs=,gm_boundaries,gm_border,gm_wards,ons_lsoa_gm
[5]http://geoportal.statistics.gov.uk/datasets/lower-layer-superoutput-area-2011-to-ward-2017-lookup-in-england-and-wales
[6] http://www.reading.gov.uk/media/1757/Councillors-Poster/pdf/Councillors_Poster_2018-19.pdf
[7]https://github.com/OpenDataManchester/data/tree/master/themes/local-democracy/local-political-representation/050918
[8]https://github.com/pkkang/Deprivation-in-England