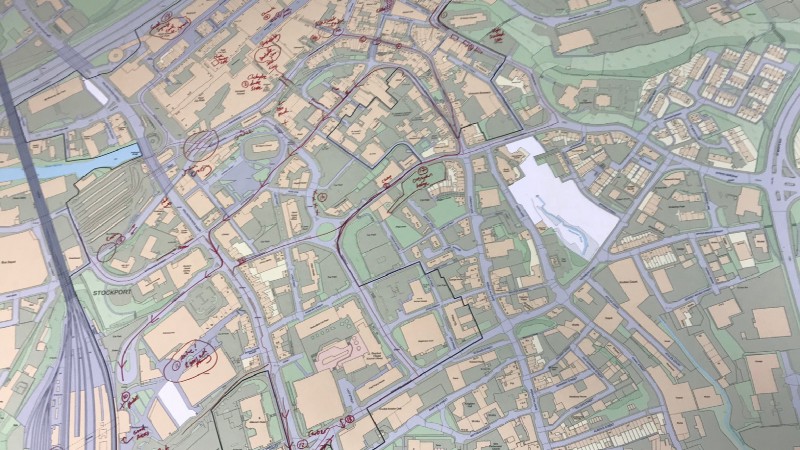
In Part 1, we looked at the Mapping Mobility Stockport project, which aimed to map the routes and strategies used by people with mobility impairments when travelling around Stockport town centre. We explored a methodology for crowdsourcing this information in a way that is detailed and inclusive.
The original aim of the project was to see whether it would be possible to create a mobility map of the town centre, and whilst we were able to collect and map this data, it rose further questions around the inclusivity of the maps we currently use.
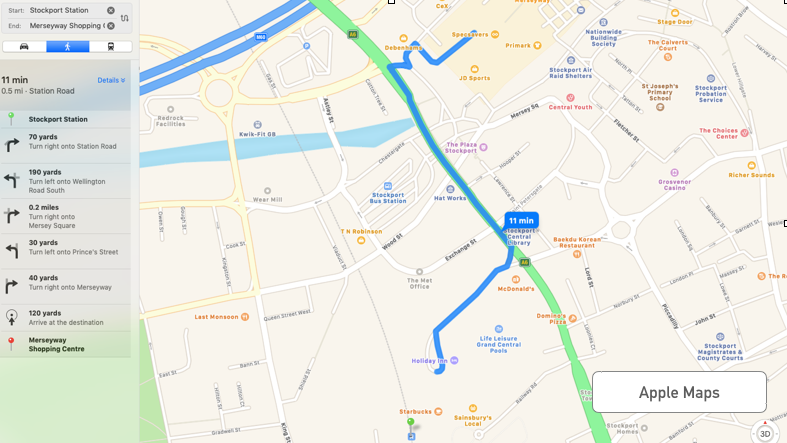
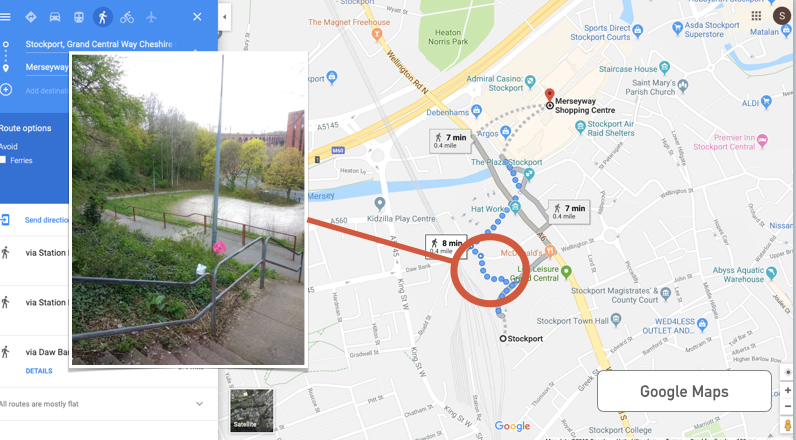
When planning to get from A to B, mapping apps tend give us the fastest or most efficient route. However, most don’t take into account accessibility or mobility needs. And whilst there is plenty of information, maps and apps that can help guide people around public buildings or transport systems (such as Wheelmap or SociAbility ), these still operate on the assumption that people with accessibility needs can get to those specific places.
That said, there are some good examples of how this can be done. This map of Eastleigh gives users an accessible route from the train station to the town centre, and this community built-map of Hebden Bridge colour codes the sidewalks so you can get a sense of how easy or difficult certain routes may be. Likewise, this map of Castelfiorentia in Tuscany has a detailed, colour-coded system for navigated the most accessible routes through the area.
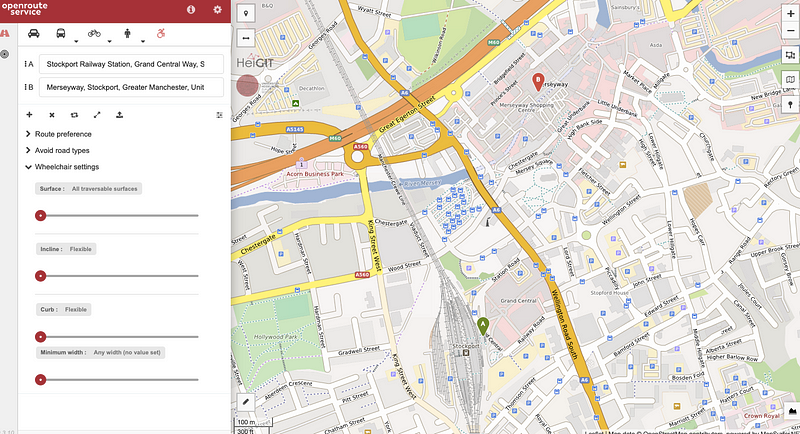
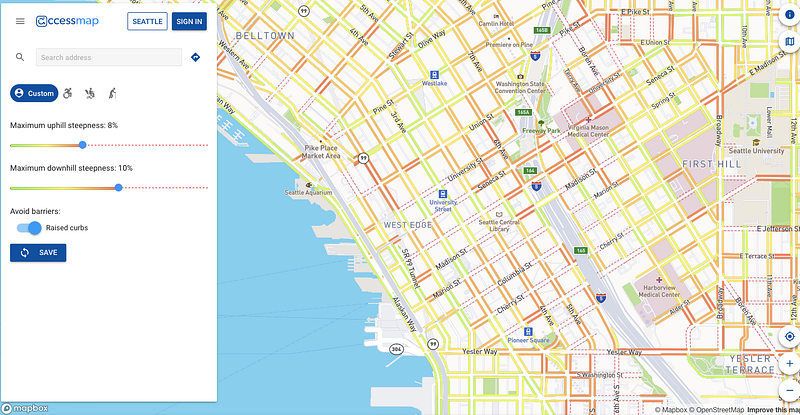
So what about digital routing software? We are starting to see a growth in awareness of the need to provide accessibility options. Whilst these haven’t made it to the most commonly used routing and mapping apps (yet), ventures like Project Sidewalk or Accessmap.io [https://www.accessmap.io] are hopefully beginning to tip the balance, although coverage isn’t widespread at present. OpenRouteService shows promise and incorporates wheelchair routing, allowing you to make adjustments to your route preferences including weight, width and incline. At present it only caters for those in wheelchairs or scooters, and like the previous services coverage is limited.
Why? Because the data doesn’t exist. There needs to be a greater awareness of the need to map mobility and accessibility in a more detailed way. Width of road, incline, camber, things like bollards or street signs in the middle of the pavement — these are all permanent fixtures that can and should be mapped, no different to dropped kerbs.
But at the same time, if we are an able-bodied person, we cannot presume to know what to look for and what to map. The Mapping Mobility project in Stockport serves a strong pilot for a methodology that can quickly and ethically crowdsource this data — and the OpenStreetMap community is one that is in the best position to push this in the right direction. After all, look how quickly they’ve managed to create the most detailed crowdsourced map of the world, and with it’s extremely flexible tagging system there’s no reason that standards couldn’t be developed for all manner of disabilities and needs.
Again, accessmap.io do look like a step in the right direction — but, to hammer a point home, we must be careful when presuming to map for people and not with or by them. From the Mapping Mobility workshops, simply mapping inclines, dropped kerbs isn’t enough. Unless we are helping those communities to map themselves, then we risk creating more biases, regardless of our intentions.
Mapping each individual sidewalk and all the data points contained on it is a huge task, but as the OpenStreetMap project has shown you only need to start small. Open Data Manchester’s Joy Diversion methodology is highly scalable, it’s inclusive, and it collects a lot of data.
So what do we need to make this happen?
- In terms of OpenStreetMap, enthusiasm is a start.
- We need to standardise how we describe these experiences.
- This needs to be led from the communities themselves.
If you want to find out more, if you’re interested in running your own mapping parties, or if you know of any other service or project that you think is worth us knowing about, then get in touch — we’d love to continue this conversation.