
When Open Data Manchester were asked if we would like to run a tent at this year’s Blue Dot Festival, held at the Jodrell Bank Observatory, how could we resist? Not only is Blue Dot a celebration of all things music and science, it takes place around the fabulous Lovell Telescope — now a UNESCO World Heritage Site. The festival was also celebrating 50 years since the Apollo 11 mission to the moon.
With so many fascinating displays and stalls at the festival, we knew we had to convey the many facets of what Open Data Manchester does clearly, in a fun and informative way that would not only demystify the world of data, but encourage people to think about how data affects their lives.
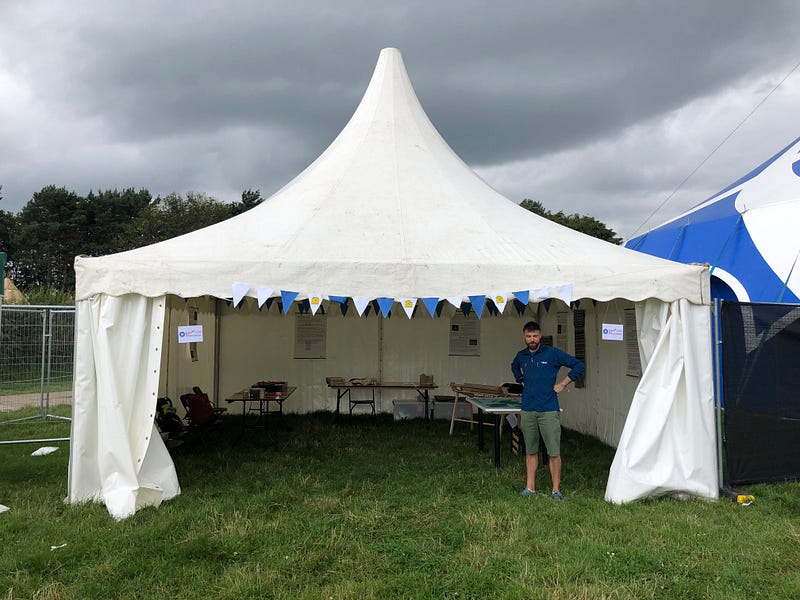
On arrival we found ourselves stationed in between the Contact and Mission Control speakers stages — a prime location.
Is everybody happy?
The first thing that people noticed when entering the tent would most likely have been our Lego map of the UK and Ireland. We asked them a deceptively simple question:
- On a scale of 0–10, how happy were you yesterday?
This question is taken from the Office of National Statistic’s Societal and Personal Wellbeing Index, which measures areas such as health, relationships, education and skills. Results are published yearly as open data.
We had a box containing 11 different coloured Lego bricks (representing each of the points on the 0–10 scale). Once they’d answered the question, they took a corresponding lego brick and placed it on the map where they currently lived. If they didn’t live in the UK or Ireland, we had each of the EU countries listed, then options for non-EU European countries, and non-European continents (and Space for good measure too).
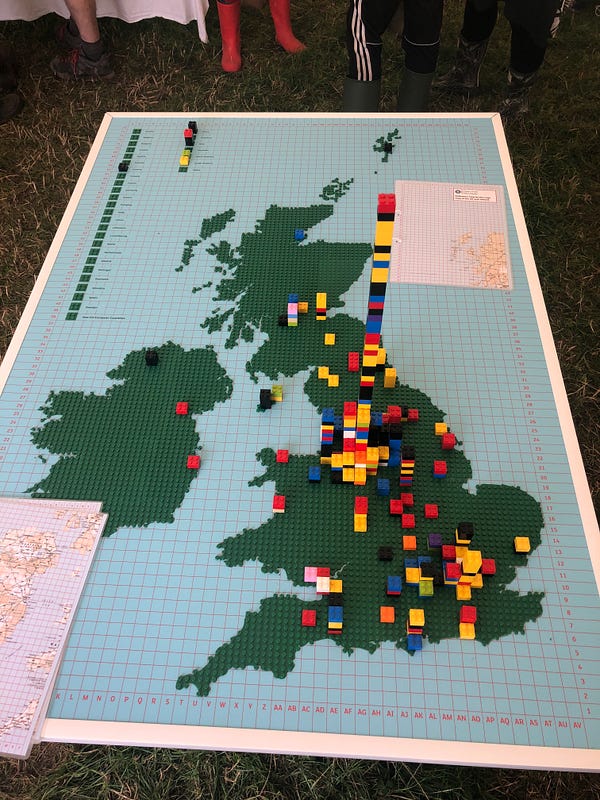
This allowed us over the course of each day to get a picture of how far people had travelled to visit the festival. It also allowed us to begin to build our own happiness index of the festival.
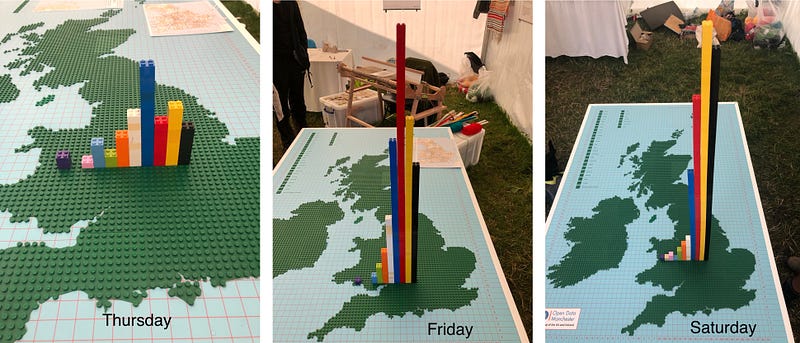
The winning result for each day:
Thursday: 7
Friday: 8
Saturday: 9.
But, as with all data collection, we must be aware of potential biases. The index can’t account for any qualitative factors or adverse events. Also, answering where you live might be a difficult question to answer.
And is it fair to link happiness in this instance with where you live? It’s an easy assumption to make, and one that many visitors to the tent made.
Although not a scientifically rigorous study, looking at the distribution of happiness after the end of each day did reveal a classic normal distribution that seemed to shift towards the happier end of the index the longer the festival went on. So as a means of making people happy, Blue Dot came up with the goods.
Demystifying data
Challenging assumptions and raising awareness of biases that can occur in data practice factors is a focus for Open Data Manchester. A lot of our work is demystifying data in this way, helping people access simple tools so that they understand data that is about them and their communities, through programmes such as Data for Communities, or Data Expeditions undertaken with larger organisations and local authorities teaching methodologies for working with data from start to finish.
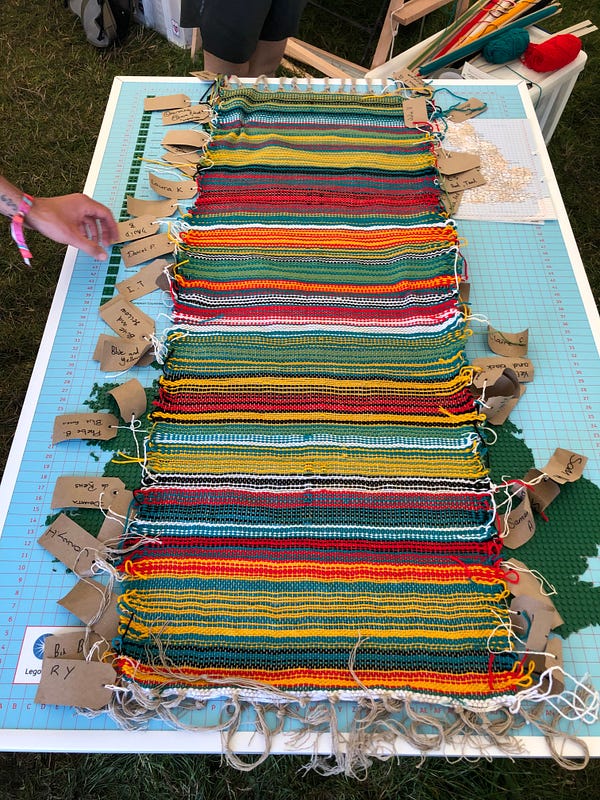
One technique we use to help people understand data is getting people to encode data about themselves. At Blue Dot, we had label makers that converted people’s names to ITA2 Baudot Murray Code, a 5-bit binary teletype code that was famously used by the Colossus computer to break the Enigma coded message in WWII. There’s also something extremely aesthetically pleasing about it.

We also used it to encode data into cloth. Visitors were invited to write down their initials onto a tag, choose two colours (representing 1s and 0s), and then our team of volunteers would work around the clock to weave this into cloth on our data loom.
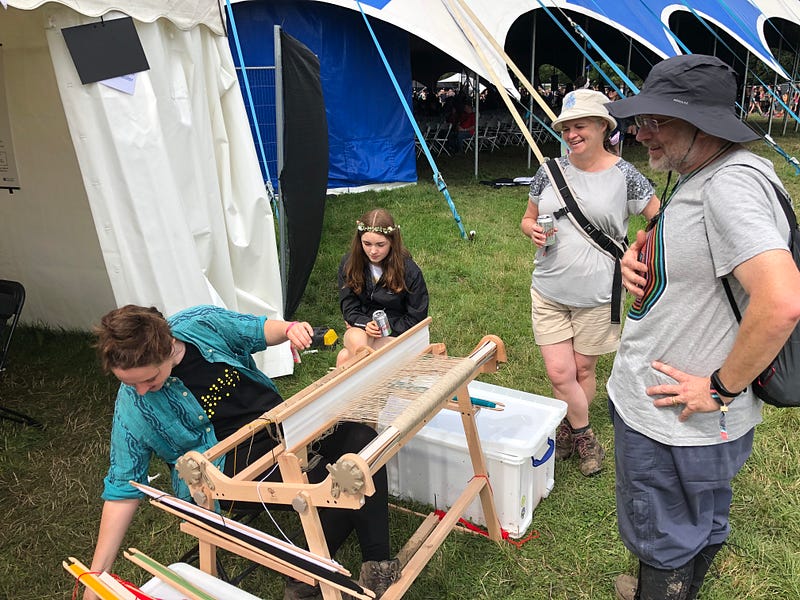
We particularly like the idea that we were able to weave a piece of wearable cloth, but one that actually contains very real, decodable data. (It looks rather pretty too.)
Data and Democracy
It wasn’t just all fun and games in the Open Data Manchester tent. We had lots more information on things like data and democracy, the importance of data standards and being ethical with data.
We had on display our 3D printed map of the 2019 Greater Manchester Local Election results, which sparked conversation around the data that elections produce — data that can reveal some insights about us and our communities, especially when shown in novel ways. With the height of each ward representing the percentage of the electorate who voted for the winner, there was some really interesting discussion around those wards with a low height — was it because of higher competition, or lower voter turnout?
We all need standards — don’t we?
We were really happy to have Tom and Sophie from Dsposal on our team of volunteers for the weekend. Aside from being forced to spend shifts weaving data into our loom, they were also on hand to talk about the Knowaste Project — which Open Data Manchester is developing a data standard for — and to talk about the importance of data standards in general.
Why are data standards important? We’re pretty good at telling if two things are different. We know a cabbage is green vegetable, or a Rolls Royce is a car. But computers aren’t blessed with this ability — although advanced analytic techniques such as AI or machine learning are starting to address this, creating data in an ad-hoc and non-standard way can severely limit its potential for reuse.
The impact on our planet from the irresponsible way we use and discard resources is beyond doubt, but how can a data standard help? We need to be able to recycle more effectively. To do this, we need to be able to describe the things we throw away. A data standard can help us track and record waste from when it gets produced to the point it gets recycled, destroyed or buried. If people can confidently identify waste, then the more chance it has of being reused as a resource rather than discarded.
Being ethical with data
And finally, underpinning everything we do at Open Data Manchester, sits the promotion of ethical and responsible data practice. Whilst some were happy to simply have their names encoded into the Data Loom or play with our Lego Happiness Index, there was a strong interest throughout the weekend around ethical use of data and our development of a Declaration for Responsible and Ethical Data Use.
We spoke with many people about the need for those of us that seek to do good with data — or at least no harm — to differentiate themselves from those that would otherwise exploit and misuse data. Whilst it felt like the Blue Dot festival goers were certainly on our side with this, the lack of any real set of principles or implementation framework was seen by many as a sticking point. Open Data Manchester continues to develop its Declaration and you can find more information about it here. We’re also running our next set of development workshops in September. You can find out more about those here.
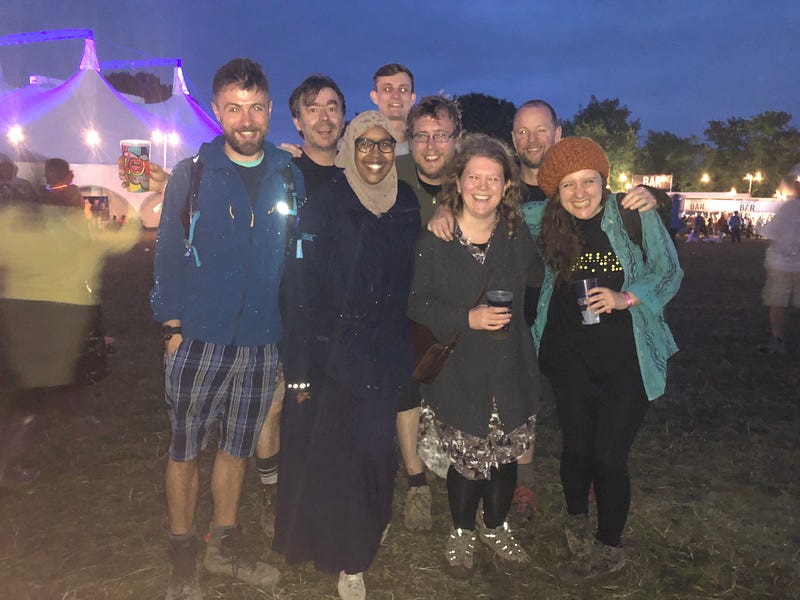
With huge thanks to our volunteers that made up Team Lovely-Winning — Tom Passmore, Sophie Walker, Damian Paynton, Dillon Wilson, Sean Borg and Kirsty Styles.
If you want to know more about Open Data Manchester get in touch. You can follow us on Twitter or sign up to our monthly mailer.
View our upcoming events and workshops.
Find out more about the Declaration for Responsible and Intelligent Data Practice.