This week saw the ‘Our Streets Chorlton’ project (the new, more friendly name for the Chorlton Climate Action Project), start its open data journey with its first community data event.
As ever for those working with Open Data Manchester, that work begins with the question ‘what is data?’, but not before we got to know Chorlton better – by asking the 20 community members who came ‘what’s your favourite thing about Chorlton?’.
Anyone who’s had the opportunity to visit or live there will know it’s famous for nice little shops, big green spaces and friendly faces – including, one person said – the folks who run the local fish shop.
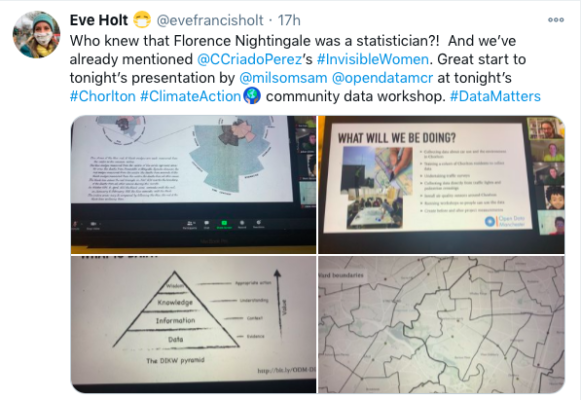
After discussing whether ‘£15 for 6GB on Giffgaff’ was indeed really ‘about data’, ODM wheeled out the trusty ‘data pyramid’, which can help us understand how we might get from having lots and lots of data, towards understanding something.
People were asked to work out in which order to put each of these ideas:
- Information
- Data
- Knowledge
- Wisdom

Answers on a postcard!
Because this project is about creating a healthier, cleaner and greener local area, people were then treated to a dive into different datasets, from Mapping GM, the Office for National Statistics and the Department for Transport, that can all tell us things about making this a reality.
If you’d like to have a go at doing the same thing for where you live, you can ‘choose your own adventure’ below to get an idea of what data about your local area can tell us.
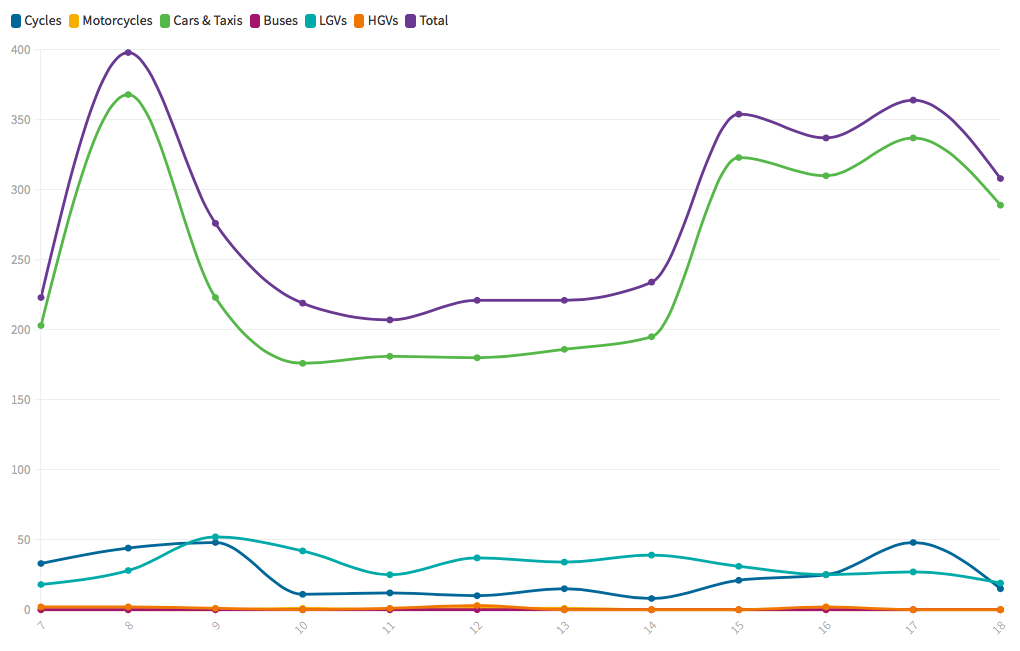
Exercise 1 Osward Road Traffic Survey
- Checkout the three slides here: https://public.flourish.studio/story/653305/
- How do the two slides showing northern and southern direction of travel differ?
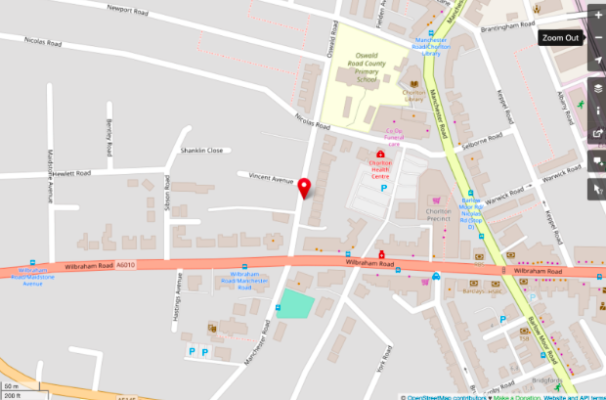
- Given the location of the traffic survey (see the map below), what might this tell us?
Exercise 2: Population and employment
- Go to NOMISweb: https://www.nomisweb.co.uk/
- Scroll down to ‘Local Area Report’. Enter a place or a postcode
- Select what geographical level you’re interested in (ie Ward or Local Authority)
- What’s the population?
- What else can you see?
- What might you need to be aware of?
Exercise 3: MappingGM
- Go to MappingGM: https://mappinggm.org.uk/
- Select ‘Maps’ from the top bar and then select ‘GMODIN’.
- Select ‘View the map’.
- Explore!
In the New Year, we’re going to help Chorlton residents become community data gatherers – on local travel and pollution – before piloting three projects designed to get people moving, so if you want to have a go email hello@opendatamanchester.org.uk.
This work is part of the £200,000 project funded by The National Lottery Community Fund’s Climate Action Fund with local charity Groundwork Greater Manchester and active travel advocates Sustains.