Open:Data:Night is an open session for anyone with an idea, project or interest related to open data and data practice. We usually host an Open:Data:Night every few months, and they form part of our monthly meet up programme. On Tuesday 28th May, we hosted a special data visualisation-themed edition.
Jamie Whyte and Sean Borg
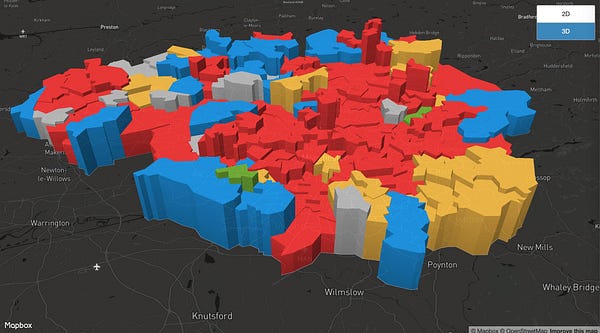
First up Jamie Whyte and Sean Borg. Jamie had created a 3D digital visualisation of the Greater Manchester local election results, which portrayed results by ward. Colour indicated the political party with the height representing the proportion of votes received by the party in each ward.
Sean Borg decided to 3D print the visualisation, by converting the geojson that Jamie had used to make the digital map into an STL file ready for 3D printing. With a 3D printer going pretty much non-stop over the bank holiday weekend (much to the annoyance of his housemate), he arrived with an unfinished visualisation, but a decent amount to show off. Some assembly was required, and attendees we invited to take part in what is essentially the world’s most niche jigsaw puzzle.

Sean has very kindly said he will donate the finished piece to Open Data Manchester so we’ll look forward to showing off the finished visualisation when we have it! He’s also written a blog about how he made it, which you can read on his website.
Gemma May Potter
Gemma May Potter’s brilliant talk showcased some of her work as a Participatory Artist, in which she uses various methods to create unique data-based pattern and craft visualisations.
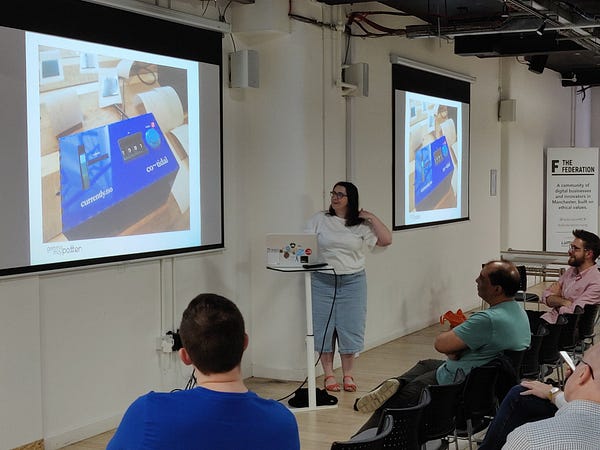
Her work often mashes up classic craft skills with data and digital work, such a knitting machine that also functions as a controller for a video game. She also showed off her interest in exploring ‘flow states’ — states of intense, almost meditative concentration that people get into when taking part in activities such as knitting or craft, exploring how these can be measured, data collected and then visualised.
Particularly of interest was virtual punch card display that compared demographic patterns of Macclesfield with 1911 census data. We were also lucky enough that she brought along a couple of knitted visualisations to share with us, and a personalised ascii pattern based on tidal data.
Check out her website for more on her work.
Kevin Pluck
Lastly, we had Kevin Pluck who took us through a series of his animated climate change visualisations. Some of his work has been featured in newspapers, with the Daily Mail calling one animated sea ice level visualisation a ‘doom spiral’! He’s also invented some animated charts of his own such as the ‘barrel chart’.
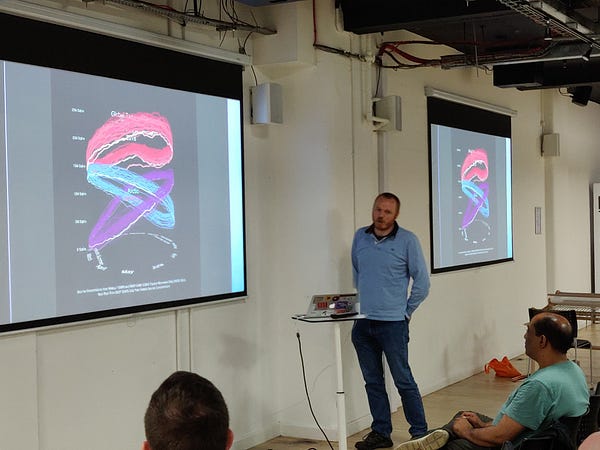
If anything his work really showcases good visualisation done well with real data, telling its story succinctly but, most importantly, accurately — even if the subject matter is really one to be hugely concerned about!
He also brought along his scale drawing on the Pine Glacier, which at about six metres long took up a lot of floor space…
Take a look at his website for more.

In all, a really interesting evening with a diverse range of visualisations. We’ll be hosting another Open:Data:Night later in the year, so if you have an open data-based project that you’d like to share, or perhaps you’re looking for a collaborator, or maybe you’ve just got a seed of an idea… come along, and get in touch if you’d like to present.
You can get in touch on our Twitter page. For all our upcoming events, take a look at our website, or you can sign up to our monthly mailer.