There is a wealth of statistical data that is created about the communities in which we live, yet these statistics, how they are created and what they reveal are often inaccessible difficult to understand or abstract. Open Data Manchester seeks to remove some of barriers and open these datasets up to a wider audience.
The Deprivation vs Political Control visualisation created last month was part of that focus and looking deeper into the data we wanted to see if there was any correlation between relative deprivation and representation at a local councillor level.
The Ministry of Housing, Communities and Local Government periodically produces the English Indices of Deprivation — the last being 2015 — which produces a ranking of relative deprivation based on:
- Income
- Employment
- Education, skills and training
- Health and disability
- Crime
- Barriers to housing and services and
- Living environment
These indices have sometimes been described as the ‘billion pound dataset’ due to their importance in the development of local and national policy, and the targeting of resources.
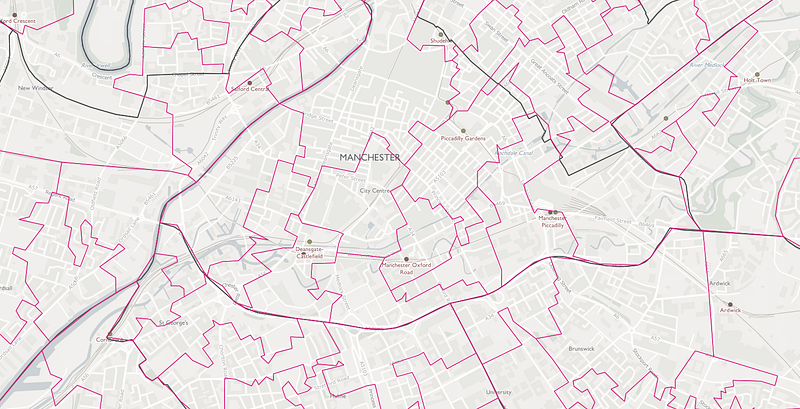
The geography that indices is based upon are called LSOAs or Lower Super Output Areas of which England is divided into 32,884 areas (2011) each containing between 1,000–3,000 people or 400–1,200 households.
LSOAs are also used as the geography for many other datasets, so being able to understand them is incredibly important. LSOAs fit within local authority (LA) boundaries and for the most part ward boundaries ,which makes the overlaying of ward and local authority level data possible.
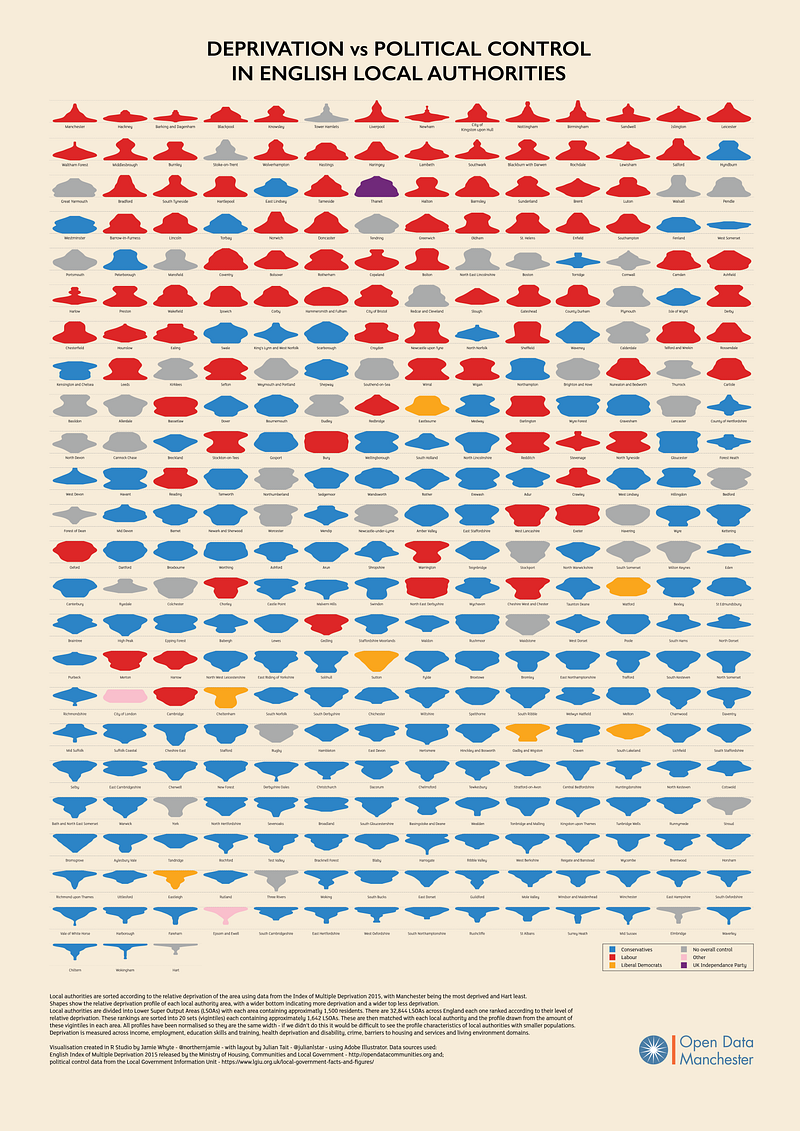
The ability to identify the levels of deprivation coupled with the political control of the authority in which the LSOAs are found enabled us to create the Deprivation vs Political Control visualisation.
The visualisation shows the deprivation profile of each LA and the party with most power, but we are interested in who represents people living in these areas at a local level and even though there maybe a dominance of one political persuasion or the other, this doesn’t necessarily reflect a more nuanced picture of representation that exists at local level.
To build this picture of local representation we first needed to identify which LSOAs are in which ward and assign the relative deprivation score to them. This was a relatively easy task as LSOAs have a unique 9 digit code and by merging the LSOA 2011 to Ward to Local Authority District 2016 with the English Indices of Deprivation 2015 Lookup in England we get a spreadsheet which has the deprivation score with ward and local authority names.
Unfortunately there is no — or none that we could find — open data set listing the political affiliations of local councillors for England. So to find and record the 20,000 odd councillors of England was going to involve a bit of pain.
Each ward has up to three local councillors and can contain from 1 LSOA such as Stroud Valley to 23 as in City and Hunslet in Leeds. For this dataset we were only interested in political representation rather than councillor details and so coded each councillor as:
C = Conservative, including Independent Conservatives and Conservative and Unionist Party
L = Labour, including Independent Labour and Labour and Cooperative
LD = Liberal Democrat, including Liberal Party
UKIP = United Kingdom Independence Party
G = Green
O = Other — Independents, Residents groups and other political affiliations
V= Vacant seat
The coding for Others was a simplification of the myriad of independents, independent groups, residents groups and other political causes listed. Overall representation was decided by party dominance per ward with NOR describing no dominant representation.
Now we have the ward, LA and coding sorted we can then easily add the councillor data for each ward. As mentioned before, the only trouble with this is that we can’t.
Journey into the heart of local authority websites.
All LAs provide information regarding their local councillors but it seems as though no-one had suggested a coherent and easy way for this information to be presented, making access challenging for humans and impossible for computers. The landscape of local authority IT is also pretty disparate with some websites being slick and fairly easy to find information and others less so — either by trying to be too clever or just plain difficult.
Realising that the allocation of political representation to each of the 32,884 LSOAs was going to be more effort than first assumed a sample set of local authorities — the 10 LAs of Greater Manchester was selected as a ‘quick win’ to see how long each authority would take to process, we are based in Manchester after all. Most of the Greater Manchester councillor information was relatively easy to find with eight out of the ten helpfully listing all the information in ward order on the page and only two needing the querying of each ward individually.
It worked out that each local authority took about 5 minutes to process so a quick calculation meant for the 326 local authorities that the data covered would take around 27 hours of work which is fairly achievable over a week. Confidently I took on Greater London and after trying to understand the City of London for too long the rest more or less took around 5 minutes each to process. Matching councillors to LSOAs was initially done in LSOA order starting at E010000001 which corresponds to Aldersgate ward in the City of London.
I had assumed that wards would have contiguous LSOAs and initially this seemed to be the case but Hackney and then Kensington & Chelsea seemed to prove me wrong. I can only assume that this has been down to ward boundary changes or the splitting of LSOAs over time. The hunting through the spreadsheet for wards started to eat into time but was quickly resolved by sorting the data on ward names so that wards were grouped together.
The assumption that the time taken to process Greater Manchester local authorities would be representative of the rest of the country was also wrong. Councillor information isn’t uniformly easy to find and Greater Manchester features strong dominant control in a number of its authorities — Manchester has only one opposition councillor out of 96 — making data entry quicker. This meant the time taken was approximately double what was originally projected.
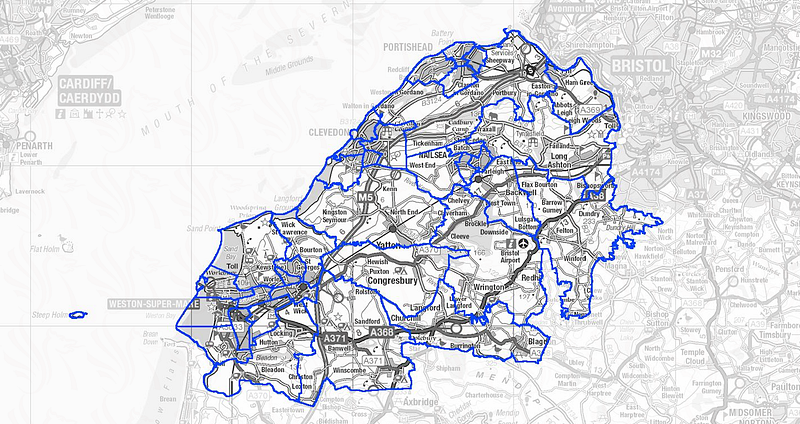
Chunking through the data was a fascinating glimpse into the world of local democratic representation. Some local authorities didn’t give up the information easily hiding the information behind interactive maps and even then not revealing political affiliations without extra digging — North Somerset being a case in point. Others hide all their councillor information away in downloadable pdf form, presumably so you can print out and display your councillors in all their resplendence.
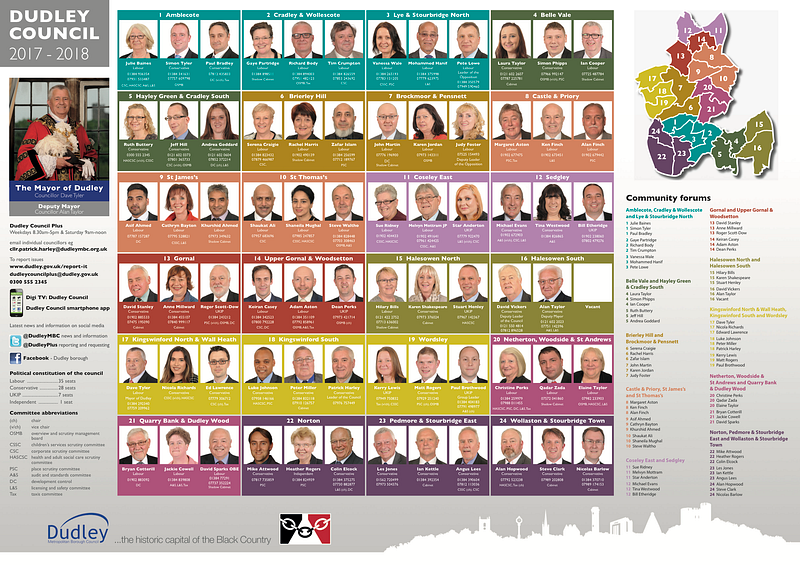
Although it would be convenient to think that all the convoluted ways to access this information are done with the specific aim of obstruction it is probably more to do with resources and perceived priorities — why would anyone want to have a downloadable dataset of councillors?
Being a councillor isn’t an easy task with irregular hours and often little praise. Looking at the 20,000 or so people who represent their communities around England, many people give up their time in the belief that they can improve the lot for their residents. Although there are exceptions there is something rather positive about that, whatever your political persuasion.
The data can be found here. Please read the associated README file for open data licenses and other information.
This dataset will hopefully add to the understanding of the local political landscape in the England and there may be patterns of representation that will create further enquiry. Open Data Manchester will be visualising the data along the lines of the Deprivation vs Political Control visualisation soon.
After the local elections in May we will look to update the data periodically and create a more collaborative approach to dataset maintenance. If you have any questions or if there is an error in the data get in touch.
Julian Tait, CEO of Open Data Manchester @julianlstar
This data couldn’t have been put together without Secret Agent on SomaFM and when things got desperate The Go Team — Semicircle