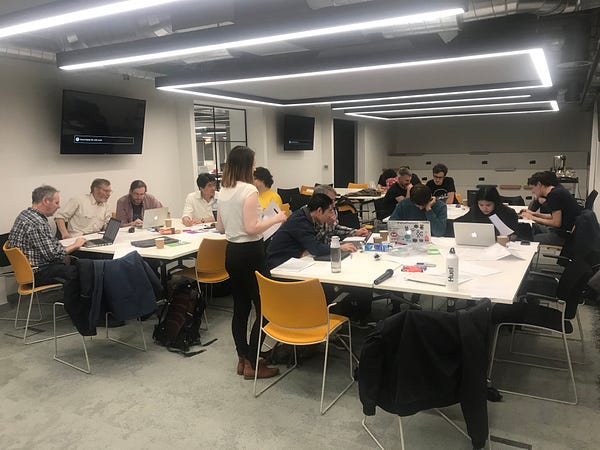
On Tuesday 26th February, Open Data Manchester decamped from our usual home at The Federation and trotted down to Tech Incubator in the Manchester Science Park on Oxford Road, where we hosted ‘Mapping Your World — a beginner’s guide to OpenStreetMap’.
Taking inspiration from our recent engagement with the OpenStreetMap community through the Mapping Mobility Stockport project, this particular event was pitched as a complete beginners guide — a short two hour session consisting of a mixture of presentation and practical exercises in which OSM newcomers would end up becoming familiar with openstreetmap.org and make their first contributions.
The presentation section of the workshop took attendees through the fundamentals of mapping, the basics of OpenStreetMap, what it is and what it’s used for. The practical exercises introduced participants to the OSM site, exploring and familiarising themselves iD, its in-browser editing system.
They were also given information on where to look if they wanted to go deeper, signposting them to the OSM Wiki, the the Tag Info wiki, and other phone apps and editing software such as GoMap, Vespuccio and JOSM.
Special thanks must go to Andy Mabbett, who came and gave a superb training session earlier in the month, and to Jez Nicholson for his knowledge and support.
Hosted by Open Data Manchester’ Sam and also Elyse Merriman (who had attended a previous training session), almost all attendees had had little or no experience of OpenStreetMap, with many having never accessed the site before.
There was a good mix of participants too — many from the local university area. One attendee came looking for a potential open source alternative for a project developing a history map of Hulme and Moss Side with their students. Another, a keen scuba diver, was interested in developing an underwater map of certain sites to help scuba diving enthusiasts. Others were just interested in finding out more.
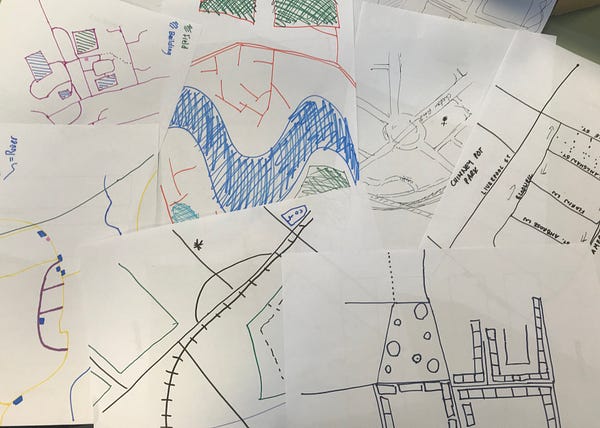
After a short introduction, which included a quick overview of the Mapping Mobility Project that inspired the workshop, we began by asking participants to draw a map of their local area. Whilst a fun icebreaker, it was interesting to start to think about what people had chosen to map, whether they’d used signs and symbols, or sets of colours — and why.
This led nicely into a general overview of maps cartography, in which we looked at different types and functions of maps. Maps show what the map-maker wants us to see, or what they think might be useful. Take this map of the Manchester marathon — it’s recognisable but any superfluous information is left out. It communicates its information in the most direct way possible.

And we discussed how accurate a map needs to be. There are some great examples where an accurate map can be less useful than a warped map. Take the London tube map and its accurate accurate counterpart, for example. Which one would be more useful in navigating the underground?
Some of my favourites include the Manchester music map, which was a great example of how datasets can be visualised creatively — in this instance famous bands and where in greater Manchester they come from.

So maps themselves as a way of visualising data led us nicely into OpenStreetMap.
OpenStreetMap, despite its name, isn’t technically a map — it’s a database of geospatial information. The map we see online is intended to be used to check any data that we are adding to it. Although, of course, people do use it as a regular map (myself included), it’s actually intended as database from which other maps are made.
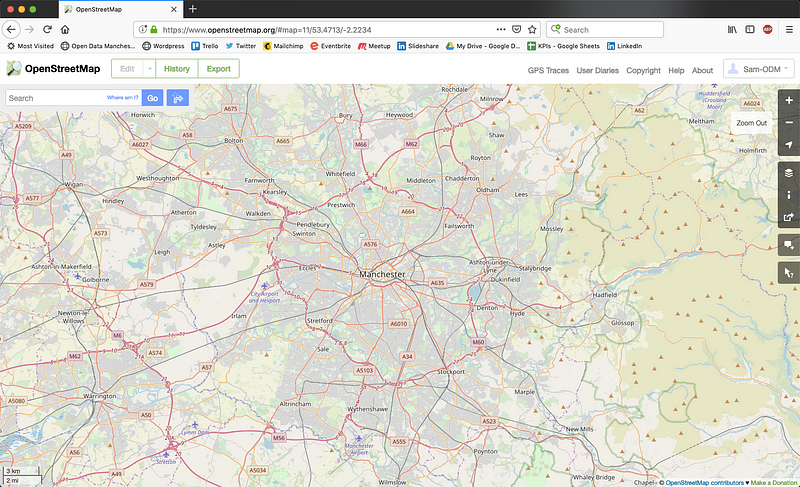
So we spent some time familiarisng ourselves with the browser, its tagging system and the data it displays. We also looked at some examples maps that have been created using OSM data, such as the European Navigable Waterways map, the Bexhill map, or the 8bit Cities project.
Then it was time for our participants to have a go themselves. Pitched as a beginner’s guide we didn’t go too deep, using only the in-browser ID editor. But after taking attendees through the basics of adding nodes/points, roads/ways and buildings/areas, along with the flexible and open tagging system, they set off exploring the map and beginning to make their first addition and edits. The only edits that were saved where those that we knew to be true — so mainly missing buildings and roads, added using the aerial imagery in browser.
We made sure that they were aware and followed some simple rules of thumb. These included:
- to be as accurate as possible ie not to map from memory.
- only map what you can see. So photographs are OK, as is adding any unmapping roads or buildings from the aerial photography in the browser.
- Map what is on the ground — so if a street name on the sign is different from what is on a council database, map the name on the sign.
- Never steal from another source — ie don’t just copy something from another map! Why? You’re probably breaking copyright, but that map may also be inaccurate…
At the end of the session we signposted to apps such as GoMap and Vespucci, along with the OSM wiki and information on OSM UK and the OSM Foundation.
But being only a short session, this was all we had time for. There’s plenty of scope to go deeper, and the demand was there too, with feedback suggesting that they’d have liked more time to work on the practical elements. Perhaps there’s scope to bring an OSM element back to our Joy Diversion events, which will return in April.
But for now, if you’re interested in talking to us about OSM, or want to know a bit more about how OSM might help a project your working on we’re happy to talk. The OSM UK community is very active and extremely approachable and helpful.
For more information on Open Data Manchester, take a look at our website, connect on twitter, or sign up for our monthly mailer.