
March 2020 marked the 10th Open Data Day, an annual celebration of open data, where groups from all over the globe run events to show the benefits of open data. This year over 300 events were organised, exploring climate data, tracking public money flows, open mapping and data for equal development.
With many councils across England declaring a climate emergency, including Manchester, we chose to focus on environmental data. We decided to get together a group of people to attempt to create a live dashboard of pollution being caused by planes coming in and out of Manchester airport.
Rather than run a competitive hackathon, we wanted to create a more informal and collaborative environment, where participants worked together towards a common cause, skill sharing and learning from each other.
Fourteen participants from various backgrounds joined us on the day, with some travelling from Leeds and Halifax. We began the day by proposing our dashboard idea, but opened the floor to any other project or interest that participants might have. The majority of participants wanted to focus on the live dashboard, but there were also a couple of side projects that explored mapping finacial and data and mapping ‘planes of interest’ over Manchester.
The Live Dashboard Group — Sami Karamalla-Gaiballa
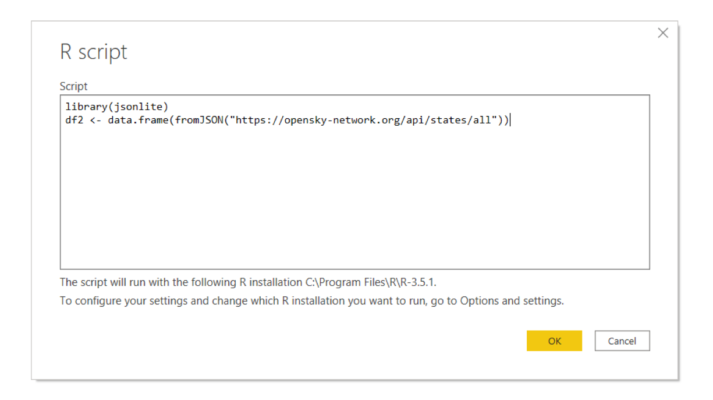
Step 1: Connect to live data with flight info in PowerBI
We wrote a script in R which allows Power BI to connect to API data via opensky-network.org. We downloaded json files and converted it to a standard dataset in tabular form.
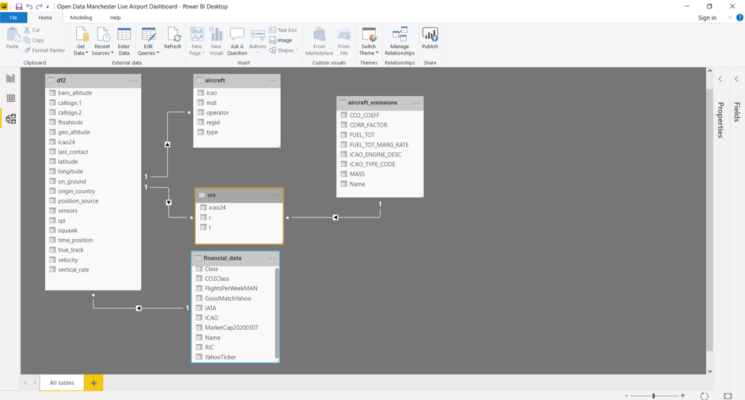
Step 2: Looking for and matching data
We managed to download some data from the internet (some by ‘copy and paste’ and some using Python) on types of aircrafts, CO2 emissions and even financial data. They were added to the main file in Power BI.
Step 3: The Dashboard
Every time you hit the ‘refresh’ button new data is downloaded and processed (via steps 1 and 2), and the map is populated. Each dot represents a flight with a colour indicating low / medium / high carbon emissions.
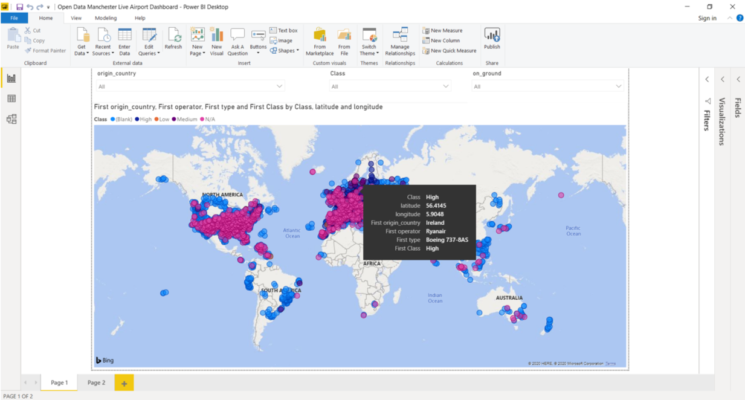
It was actually more difficult than it sounds — but we did the best we could give resources and the limited time we had to work on it.
You can view the outputs for the airport dashboard here. (Please note that at present you will need Power BI to access it.)
The Finance Group — Phil Reed
We set up a small subgroup in the live dashboard project to add financial data for each airline arriving into Manchester. The idea was to consider the airline company level, instead of the flight level, because a different kind of data would be available. These data could be reported emissions at a corporate level instead of an aircraft level, which airlines are most involved in carbon offsetting, or which airlines are in a riskier financial situation. (If one airline went out of business, what would be the local environmental impact?)
Large companies in the UK have been required to report their energy use, efficiency and carbon emissions in their annual reports since April 2019, along with usual accounts data such as revenue and profit. There are similar rules for companies to report environmental impact data in other countries. Environmental, Social and Governance (ESG) issues are an increasingly major part of a corporation’s reputation for customers and investors. There is much aggregated research and publicity on these topics, much of which is available through expensive, closed sources. In the long term, for a fully open project, we would have to rely on what is available through each company’s annual report sourced one-by-one.
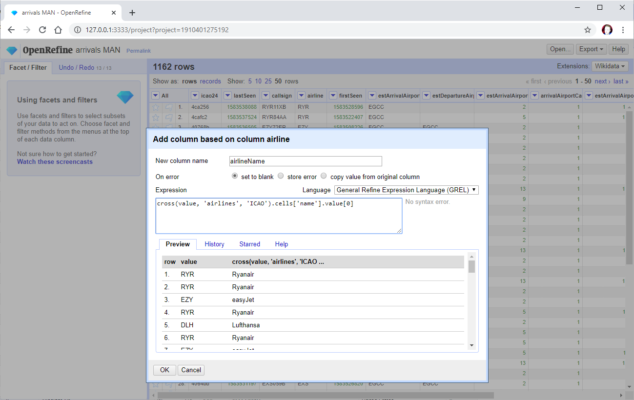
We were able to make a list of flights that arrived at Manchester Airport in the previous week using data from OpenSky. We cross-referenced that with a table of flight codes to airline names on OpenFlights to produce a tally of Manchester-bound flights by airline using the ever-useful OpenRefine tool. We then calculated a rough carbon classification for the airlines in the sample:
- the tonnes of carbon dioxide equivalent that the company claims to have produced in the previous year,
- divided by the revenue of that company (in millions of US dollars),
- this ratio was classified as low, medium or high relative to our sample.
Finally, this classification was added to the live dashboard for the airlines we had worked on, as described above. The code is available to view on GitHub.
This code has a lot of manual processes, many of which could be automated, or only updated annually. We successfully started to look at other angles to take and were inspired to think of many research questions which could be looked at another time.
The Interesting Planes Group — Alice Kaerast
Unlike many hackdays, this hack day was very collaborative and as much about learning to use data as building something shiny. With that in mind, one of our projects was very much about building something from first principles rather than using existing analytics tools. We used the OpenSkies Python library to get data about the current planes over the UK, joined that to a database of aircraft types, and returned some geoJSON to render different plane icons on a map with leaflet.js.
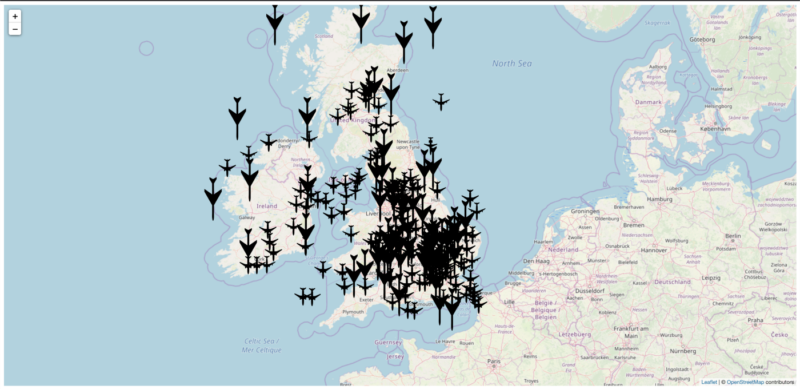
We achieved slightly less than the team using PowerBI for analytics, but we all learned a lot about how to build something like the commercial flight trackers from scratch.
We also learned a bunch of more specific skills around how to build this. From munging data in Pandas, to working with GeoJSON, to writing a Flask app, to rendering maps with Leaflet.js, to (not) dynamically rotating images with Python. Our team had architecture, data science, full-stack development and devops skills that ended up working really well together.
You can check out the source code and run this yourself via Alice’s github here.
Open Data Manchester CIC runs regular monthly meetups alongside other events and workshops. If you want get involved or find out more about what we’re doing, you can follow us on Twitter or sign up for our monthly mailer.