As part out Our Streets Chorlton, Open Data Manchester has been running monthly ‘Data Chats’, where we explore some of the data collected by the community.
In February, we were joined by Blaise Kelly, an air-quality expert and ex-Chorlton resident, who gave a talk on how the weather in Chorlton can affect air pollution, before giving some real examples using data collected by our air-quality monitors.
Below is a short blog exploring some key things we learned from Blaise’s talk – or you can watch the full video online here:
A bit about weather data
- There is a large amount of weather data freely available from sources such as the National Oceanic and Atmospheric Administration, the Environment Agency or the European Centre for Medium-Range Weather Forecasts – but you’ll need to know a bit of the programming language R to access it
- You’ll also need to do a bit of data munging (transforming data from one format to another) to consolidate this data with the air-quality data. For example, the weather data Blaise uses, taken from Manchester Airport, has data with time stamps of 20-past and 10-to every hour (ie XX:20 and XX:50 where XX is the hour), whereas our air-quality data is in minutes.T hankfully the openair, worldmet and dplyr packages make this a lot easier.
- Blaise has written some code to help and you can find it here.
Darley Avenue, particulate matter and NO2
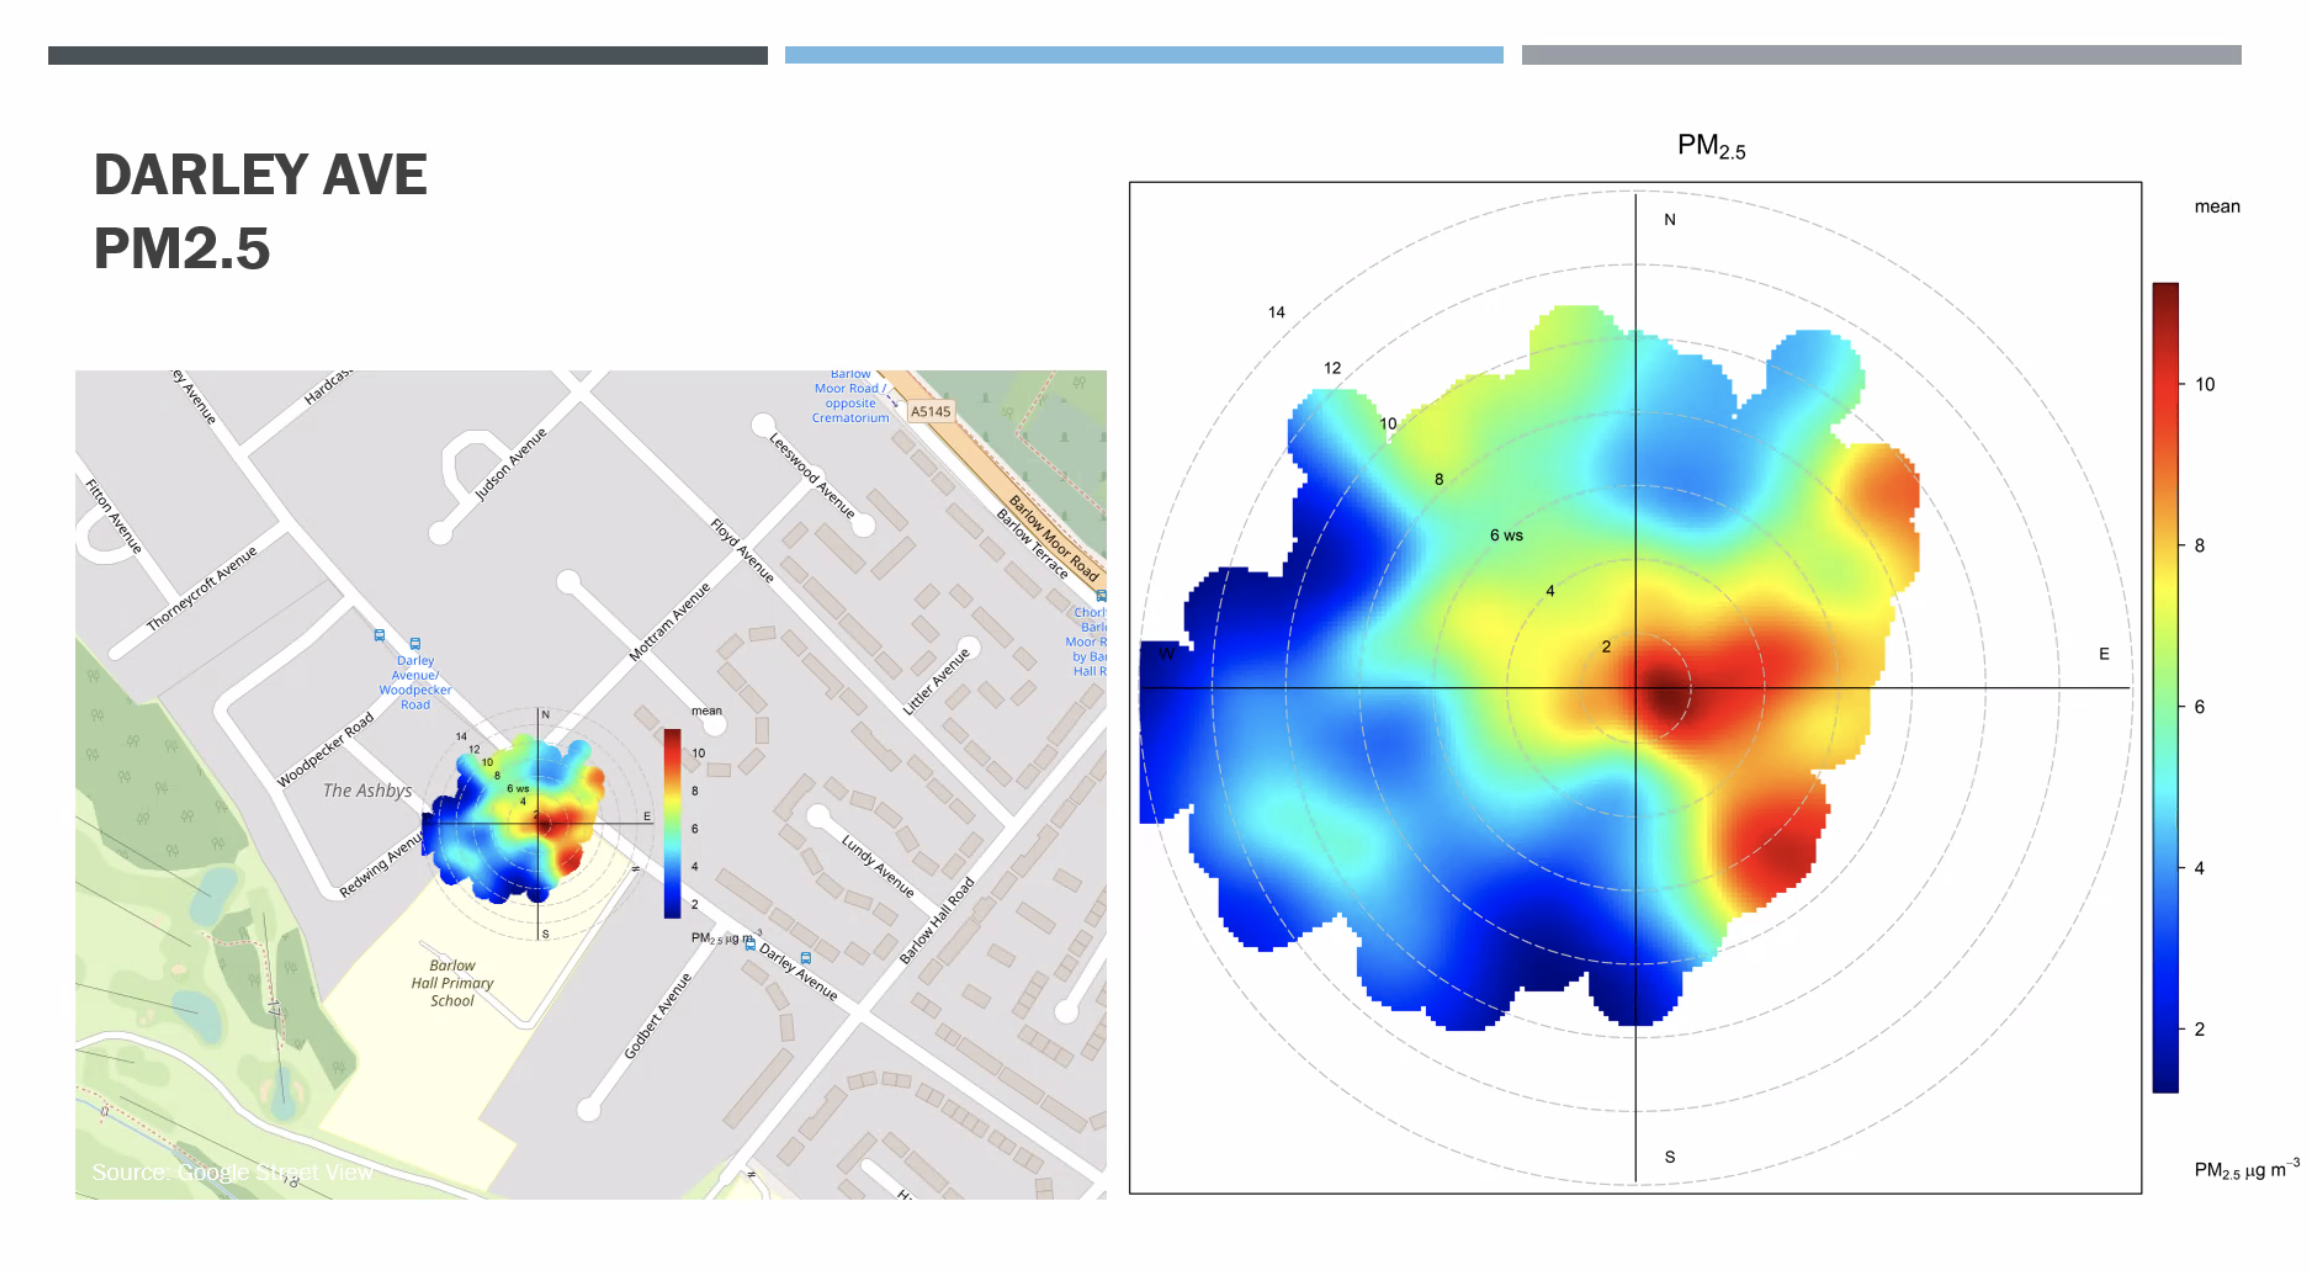
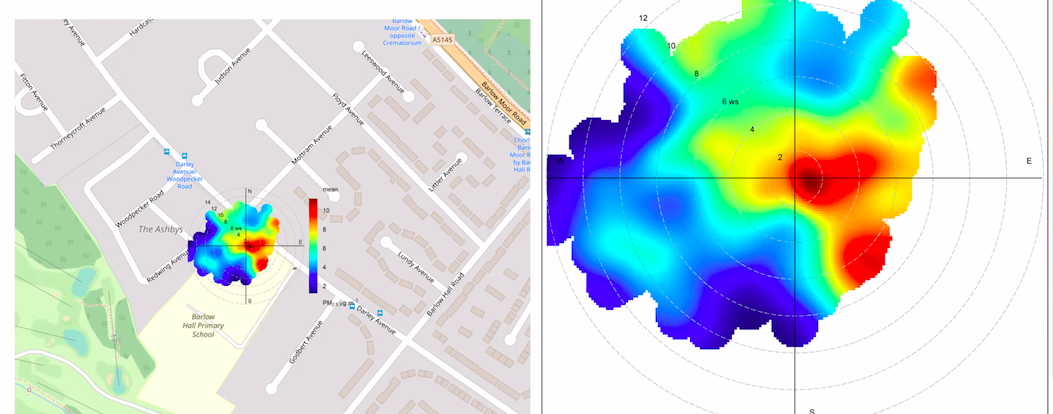
When looking at Darley Avenue, there were high concentrations of particulate matter (PM2.5) – everything found in the air that isn’t a gas – which registers when the wind blows from the road and houses.
The highest concentrations at Darley Avenue were found between 8pm to 9pm, so the initial thinking was that it would be related to household heating – such as wood burners. However, these highest concentrations occurred when the temperature was in the 11-15 degrees range – potentially too warm for heating from people’s homes – suggesting this was actually coming from the road in the evening.
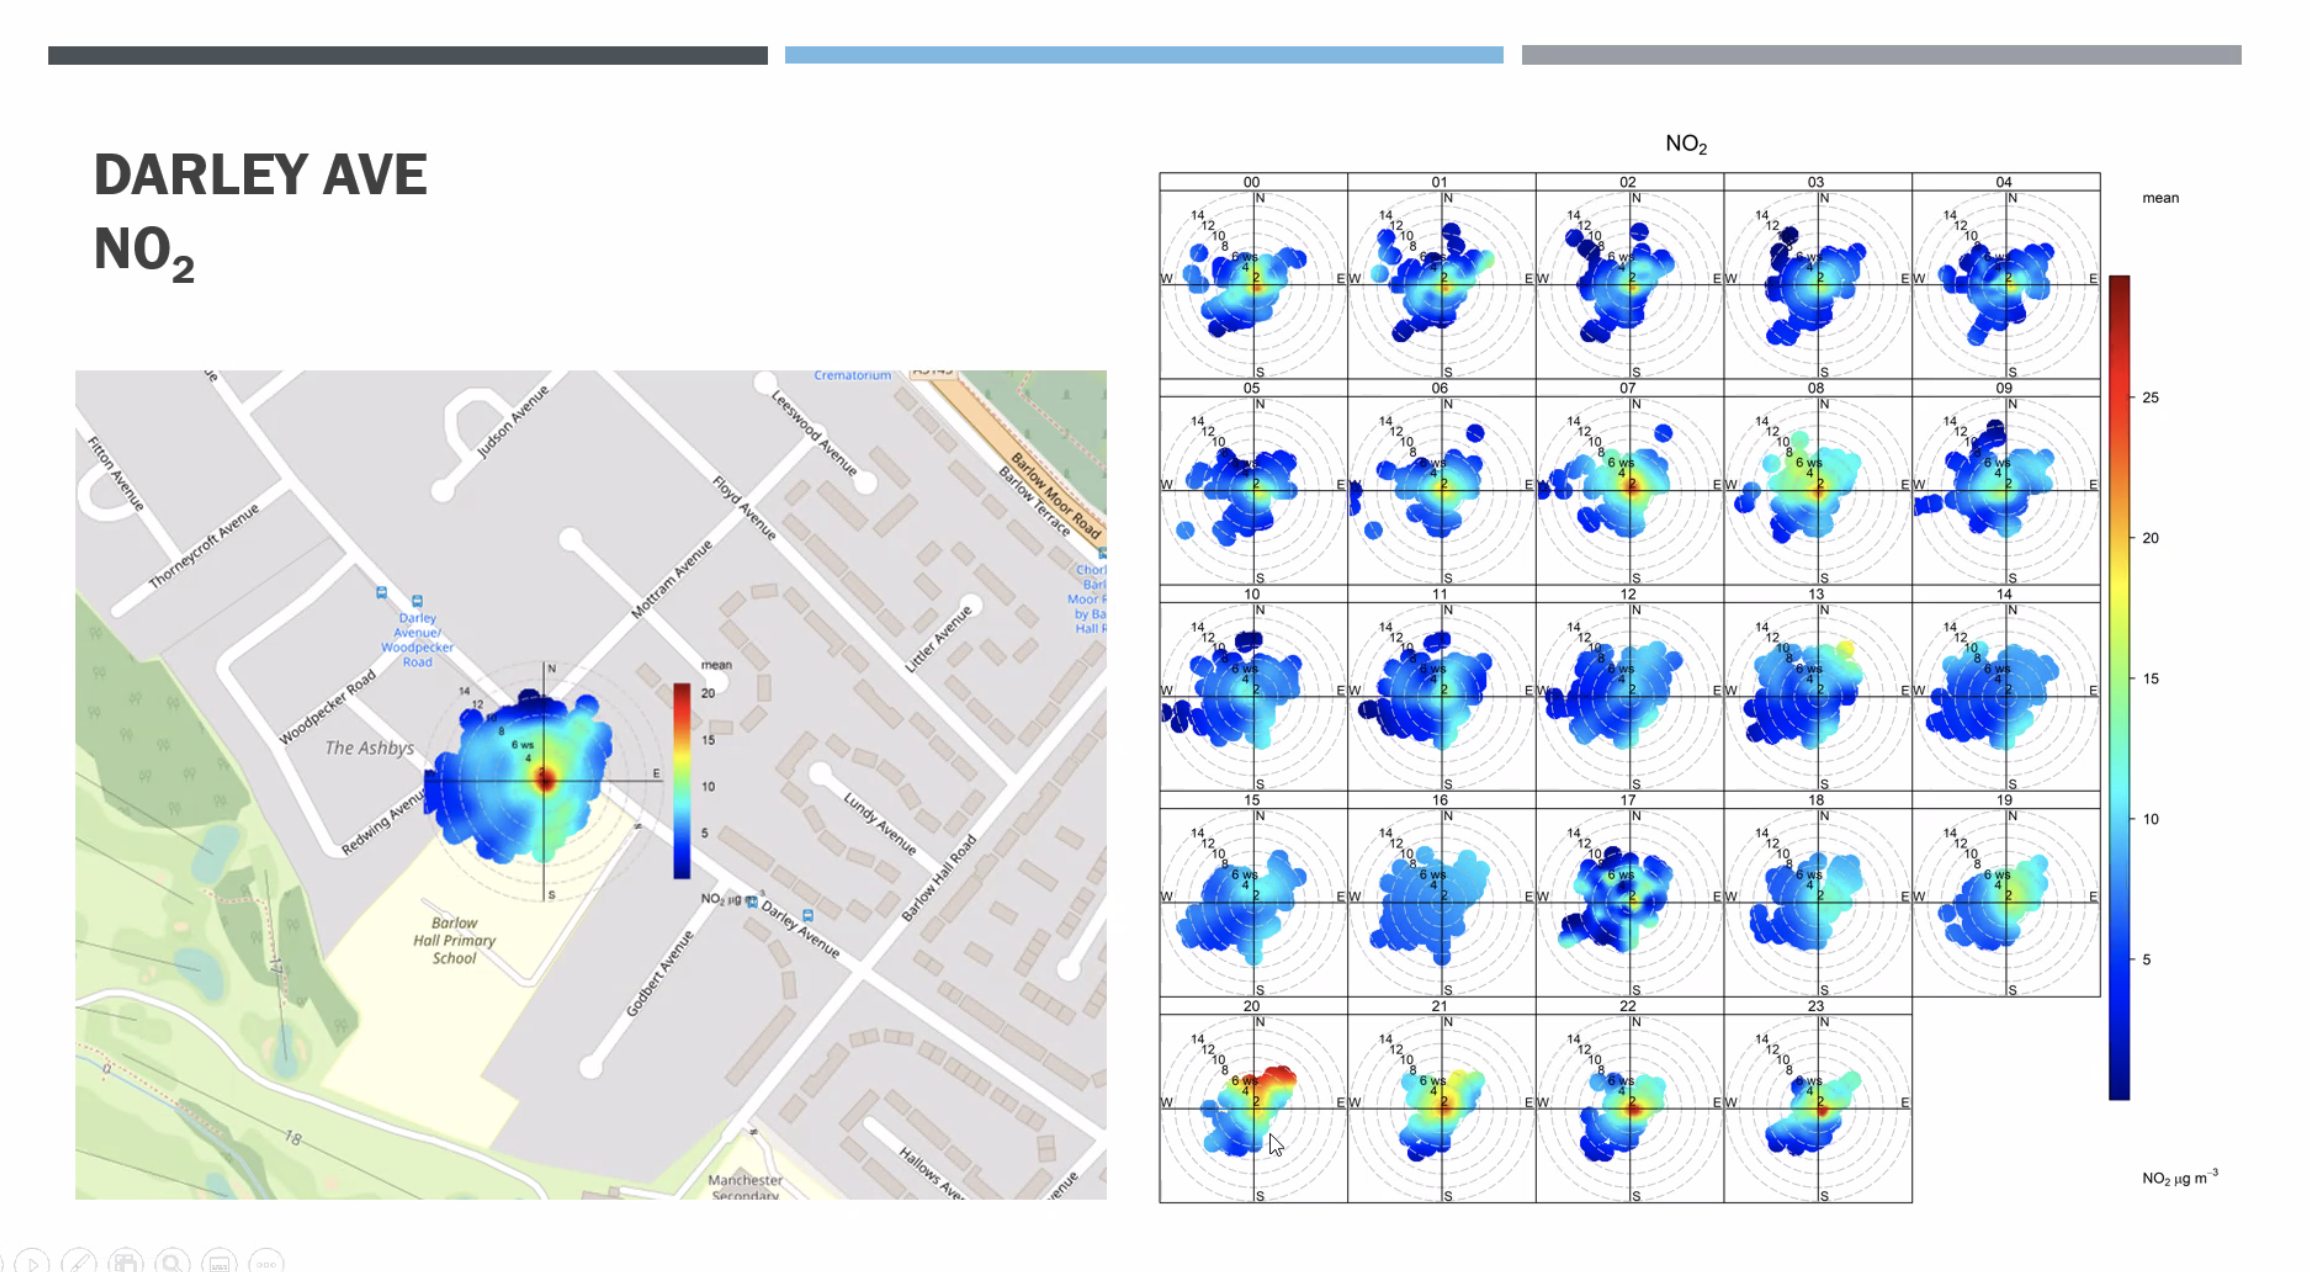
Nitrogen dioxide (NO2), mainly produced from burning fossil fuels, breaks down quite quickly so readings are less influenced by wind. For every metre or two you get away from the road, NO2 drops off quite significantly. Gas boilers are the second-highest source of NO2 pollution, but they tend to be next to people’s houses and not on the roadside. As our air-quality monitor on Darley Avenue was located on the roadside and away from any building, it is highly likely that any NO2 reading picked up is from cars.
This is backed up by the fact that there were high concentrations of NO2 at the same time as high PM readings. There are notable peaks for both pollutants between 7am and 8am.
Data from our Four Banks location showing the boundary layer effect
The ‘atmospheric boundary layer’ is a part of the Earth’s atmosphere that directly affects, and is affected by, the Earth’s surface. It can range from a few metres high to a few kilomteres high, depending on the weather.
When the boundary layer is high, weather tends to be clear and sunny. When the sun is shining, NO2 breaks down much faster to form ozone (O3). Therefore, when the weather is clear and sunny we can expect to record lower levels of NO2 and higher levels of O3.
When the boundary layer is low, there tends to be less sunshine, and therefore less ozone recorded. However, NO2 will be higher. Examples of this effect were demonstrated using the data from the air-quality monitor data from Four Banks.
Mystery pollution at Sandy Lane in December
From August onwards, we relocated our Darley Avenue monitor to Sandy Lane. NO2 levels remained relatively low until December, when high concentrations were recorded, with the highest levels between 10am and 3pm.
With such a spike in December, Blaise queried whether there was any construction machinery nearby, either on Sandy Lane itself or on Nell Lane – as the wind was blowing from the south east, it could have come in from this direction.
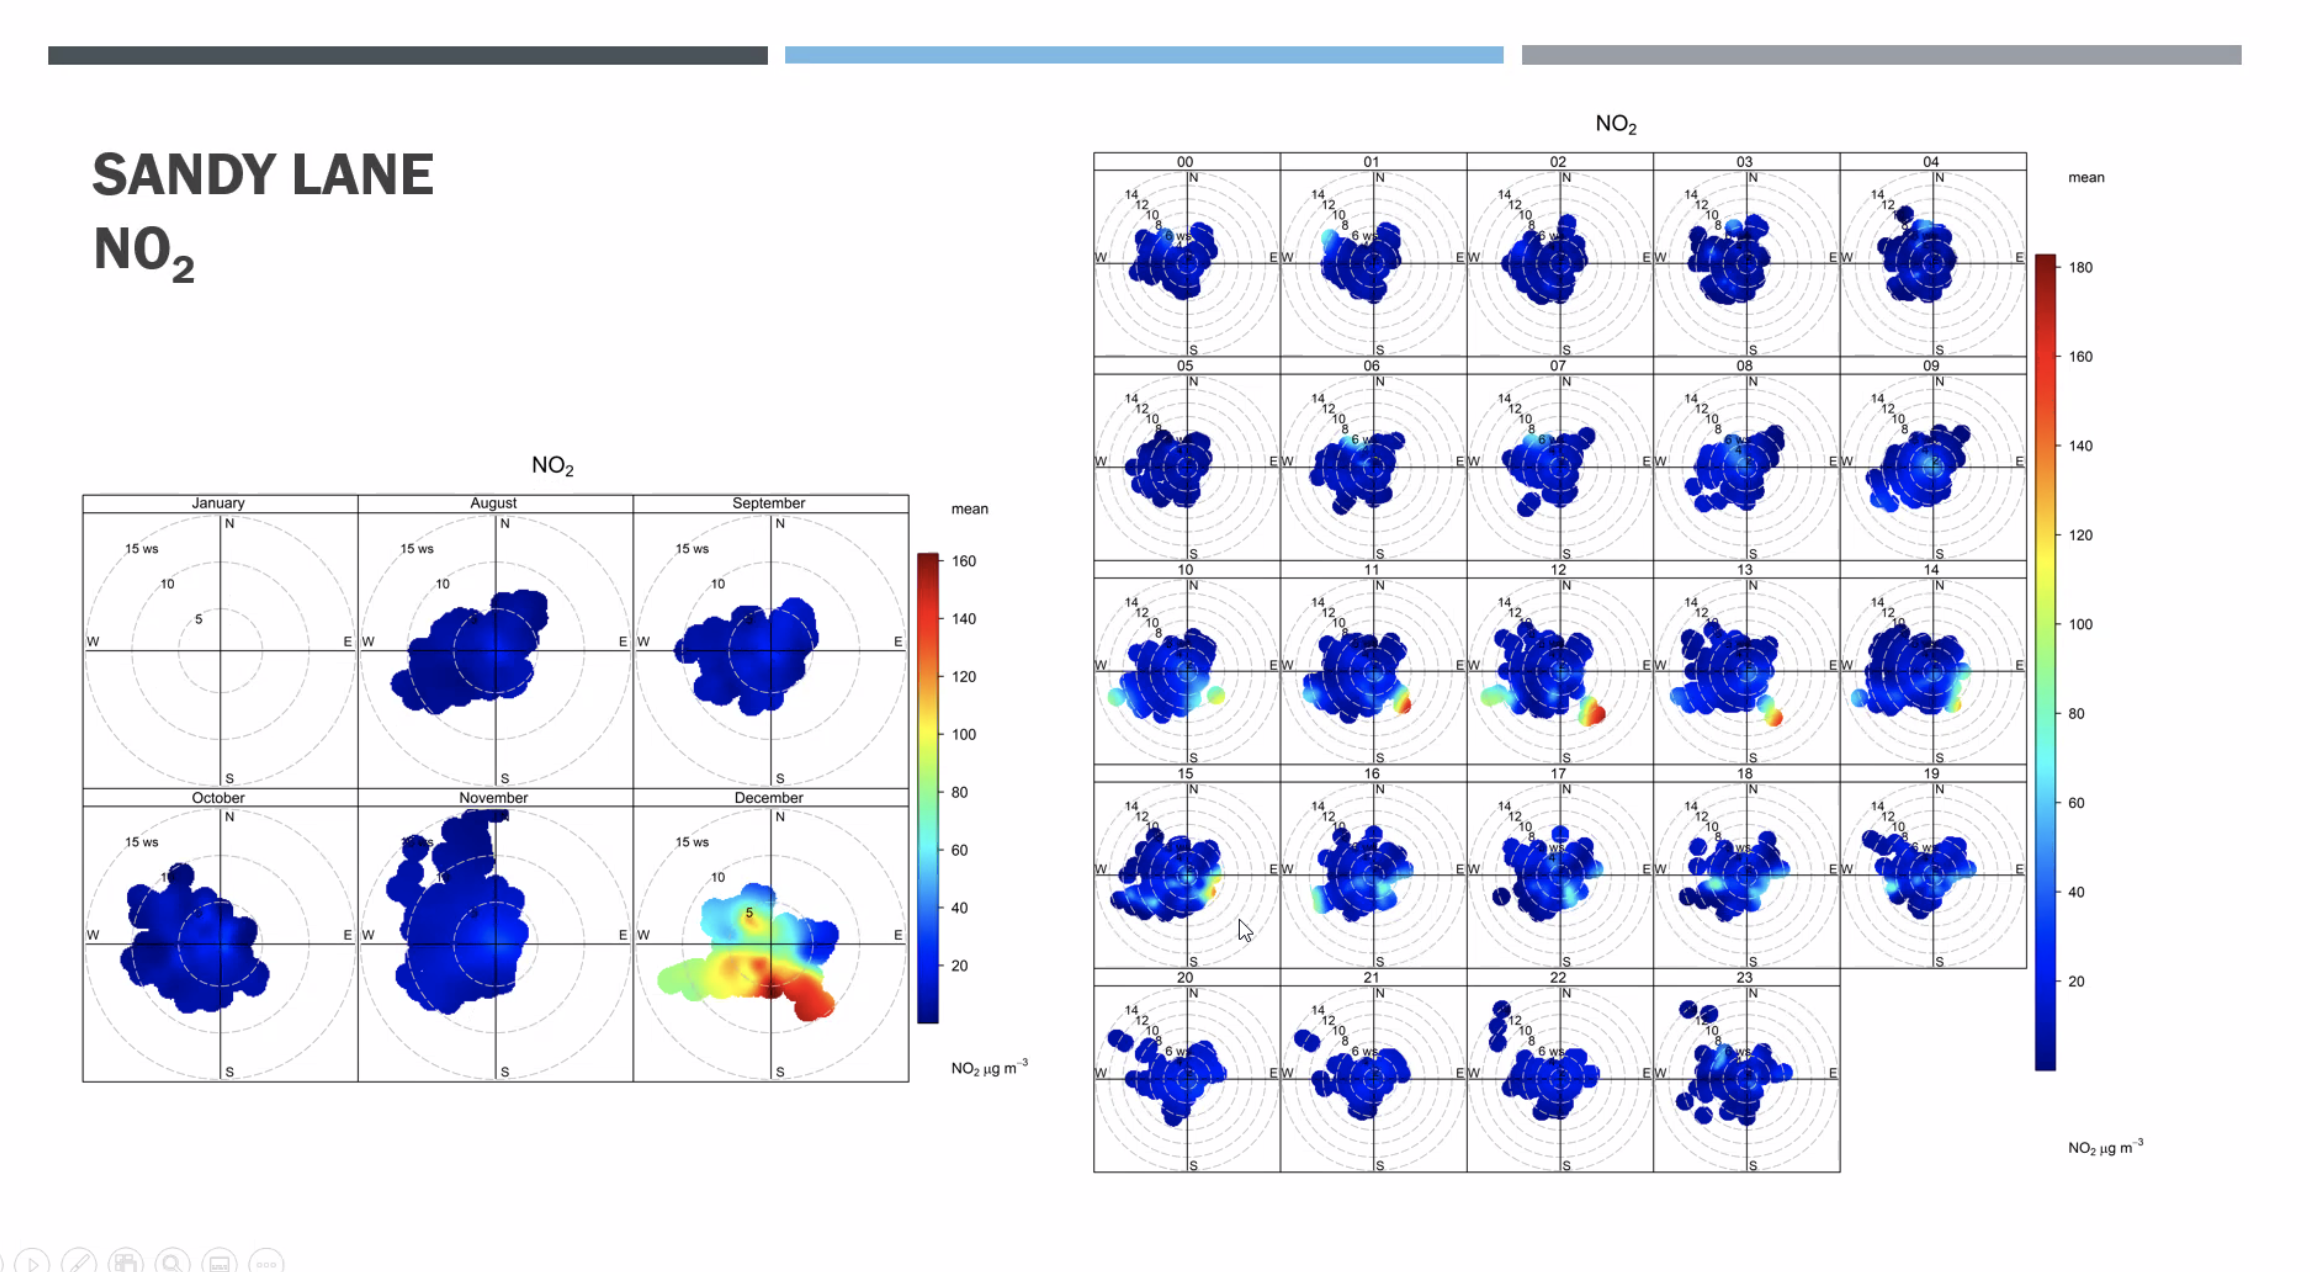
One suggestion was that this could have been from nearby construction machinery – particularly as non-mobile road machinery doesn’t actually have to pass any emissions standards – and so could have been contributing to this sudden spike in readings. But a few residents local to the area couldn’t recall there being roadworks at this time.
If you have know what may have caused this spike in NO2 in December, let us know either by email or on Twitter.
For a more in-depth exploration into how weather affects air quality, and a deeper exploration of the Chorlton data, watch the full video of Blaise’s talk.
For more information on Our Streets Chorlton visit their website or sign up to their newsletter.
Or you can sign up to our monthly newsletter to stay up to date with all our latest news and events.