Data has traditionally been used as a tool of management and control. In cities especially, data determines how things work, where intervention should happen and how impact should be measured.
12
May
May
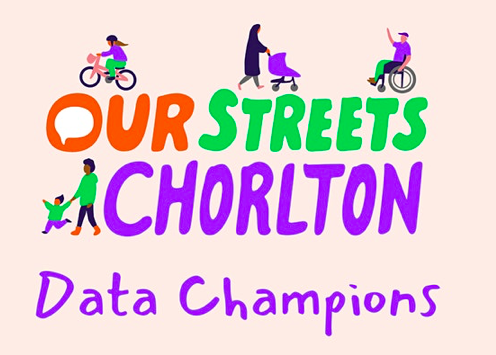
This five-part blog series explores Open Data Manchester’s approach to community-led data collection, showcasing our methodology and impact across various projects. Part 4: Our Streets Chorlton – The Data Champions
31
Oct
Oct
Open Data Manchester is developing a Community Data Handbook – an open resource that will enable communities to carry out their own data projects. Throughout 2021, as part of Our Streets
01
Mar
Mar
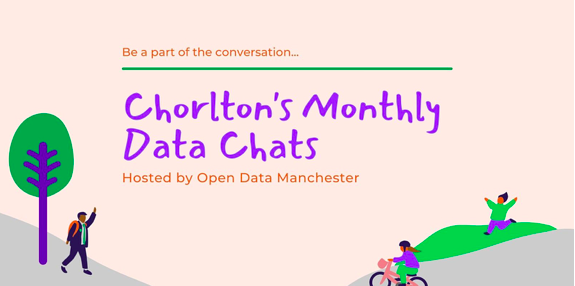
As part out Our Streets Chorlton, Open Data Manchester has been running monthly ‘Data Chats’, where we explore some of the data collected by the community. In February, we were
31
Jan
Jan
Join us online to reflect on the past year of the Data Champions programme – and to help shape its future.
31
Jan
Jan
This is aimed at anyone who wants to help develop tools for communities to collect, use and understand data about where they live.
31
Jan
Jan
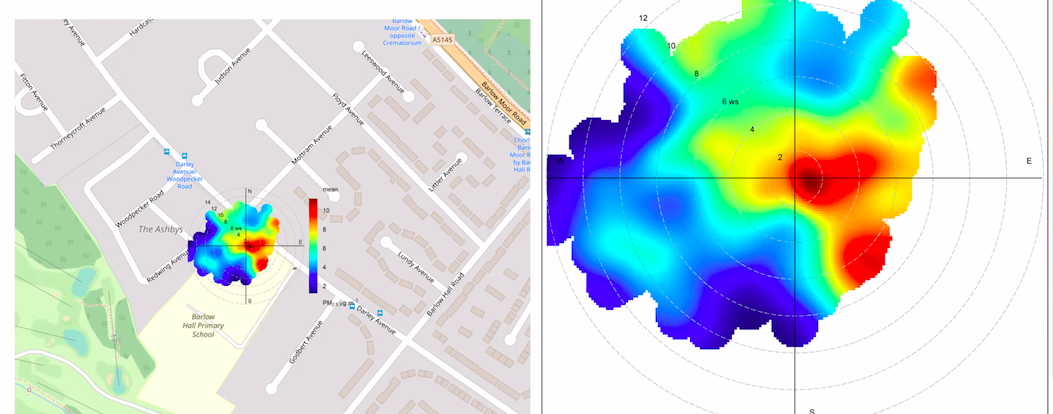
This month’s Our Streets Chorlton chat will see us joined by former resident Blaise Kelly, who’s been looking at local air-quality data.
28
Jan
Jan
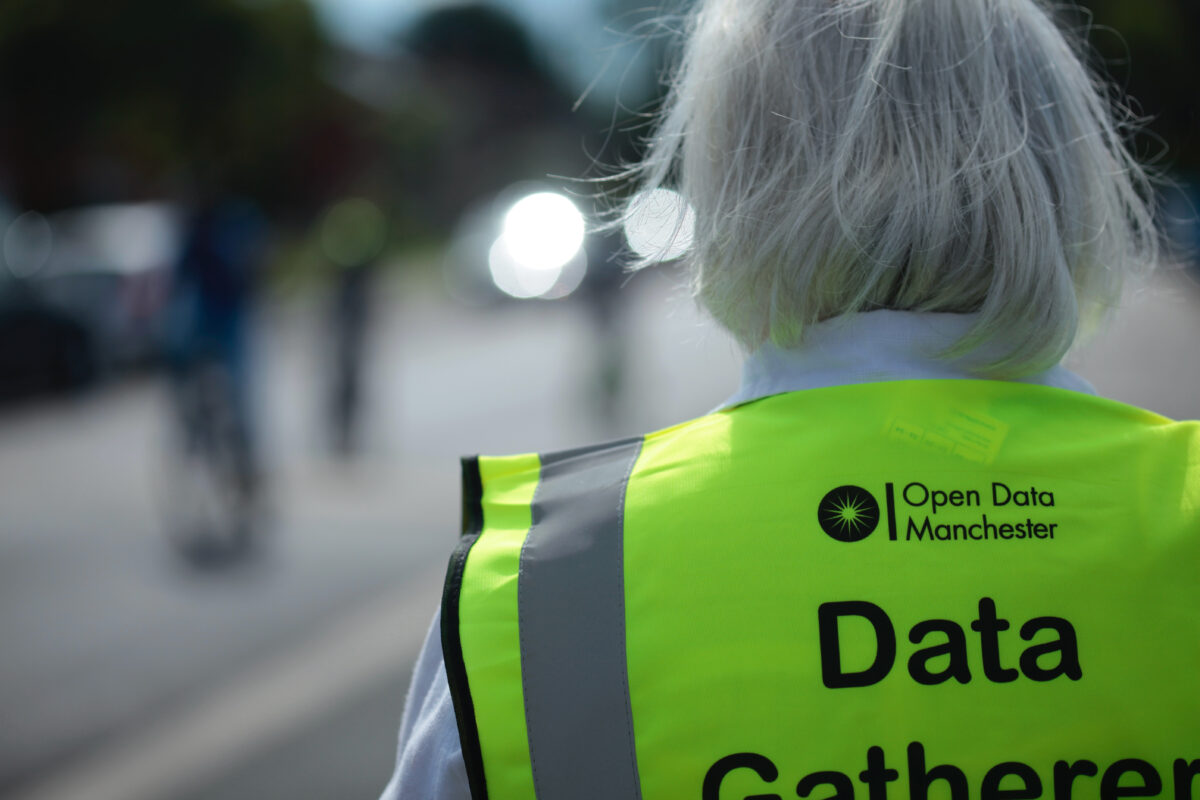
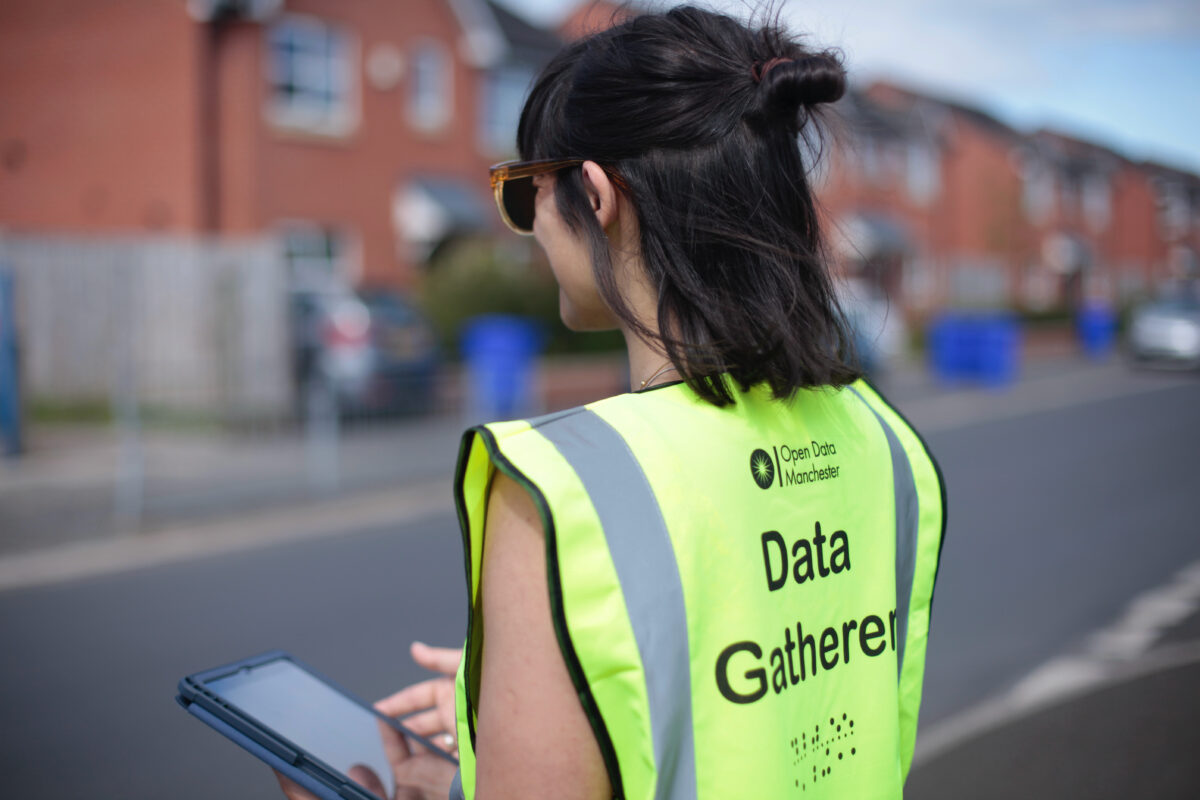
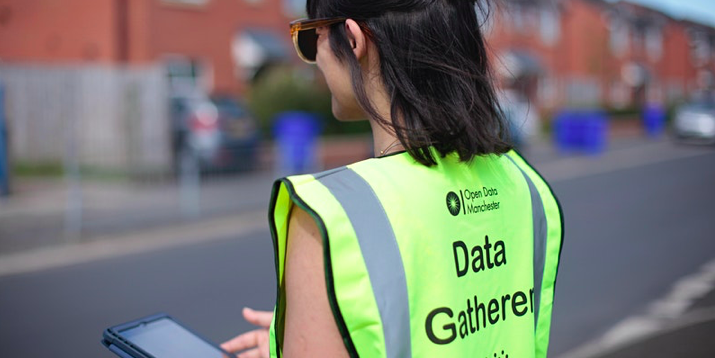
Over the past year, Open Data Manchester has been carrying out community-led data collection, including local traffic counting and air-quality monitoring as part of Our Streets Chorlton. A group of
10
Jan
Jan
We wrote that 2020 was a year like no other – while 2021 – was one where things felt a bit too much like more of the same. In the
07
Dec
Dec
As part of Our Streets Chorlton, Open Data Manchester has been carrying out data monitoring and collection, including local air-quality measurements and traffic surveys. Over the past year, we have