As part of Our Streets Chorlton, Open Data Manchester has been carrying out data monitoring and collection, including local air-quality measurements and traffic surveys.
Over the past year, we have organised a number of resident-led, manual traffic counts carried out by volunteers that we’ve trained from the community. Each month, we also get together with local people for a ‘data chat’, a friendly and informal exploration of some of the data the community has been collecting – to explore what it tells us, what it doesn’t – and dive into some of the questions we may have about it.
Earlier this year, Our Streets Chorlton was approached by residents from Egerton Road North, a road in the Chorlton ward, because they felt it was being used to avoid the busy Manchester Road, as well as the traffic lights at the junction of Barlow Moor Road and Wilbraham Road, known as ‘Four Banks’. Residents said the volume of cars using the road was too high, and they were travelling too fast, and this was causing accidents.
Although Our Streets Chorlton is not a campaigning project, we decided we could help local residents collect data to help give them a better sense of the actual traffic levels on the street. So on 14 October 2021, we organised a community traffic count, attended by both the Our Streets Chorlton Data Champions and residents of Egerton Road North.
For the November ‘data chat’, we presented and explored some of the results with residents.
What we did
For the community-led traffic counts, we try to collect data in the same way as the Department for Transport road-traffic counts. But, as a result of some co-design workshops we ran earlier in the year, we now count extra categories, including pedestrians, wheelchairs and e-scooters.
Traffic is counted from 7am to 7pm, with the day divided into one-hour shifts, with two volunteers counting one direction each. A third person, a member of the Our Streets Chorlton team, is on hand to offer support to the counters and speak to the public where needed.
Location
Choosing the exact location for the count proved much more difficult than another count conducted on Darley Ave and on Burrows Avenue earlier this year. Egerton Road North has multiple roads leading on and off it – some that are small residential side streets, some which are much larger through-roads.
So, we had to accept that we wouldn’t be able to choose a location that would accurately represent traffic levels along the entire road, but instead, one that would give us a suitable indication of what is going on.
From talking to residents, we also knew that the north and south ends of the road appear to have two very different issues – the north end of the road is more concerned with speeding cars turning off Upper Chorlton Road, the southern end with congestion caused by cars trying to join Wilbraham Road.
With a Telraam counter already positioned at the Wilbraham Road end, we felt it would be more useful to direct our resources towards the middle or northern end. Ultimately, we have to put the safety of our volunteers first – so picked somewhere with plenty of pavement space, away from the busy road and not blocking anyone’s drive.
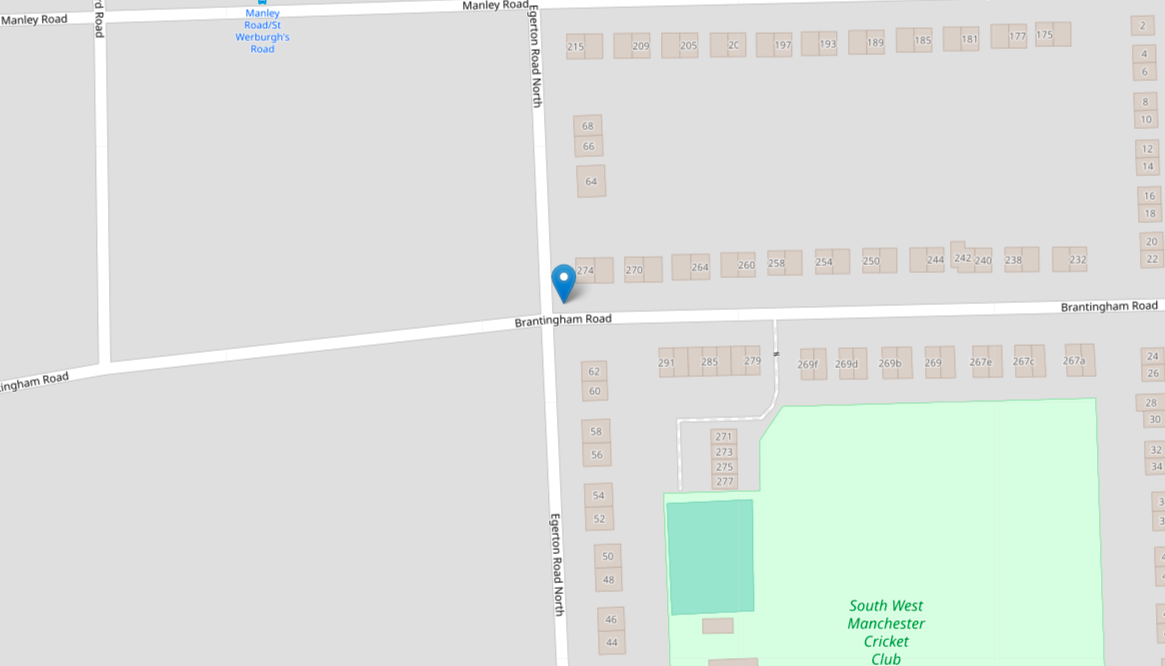
After some careful deliberation, we decided on the corner of Egerton Road North and Brantigam Road, positioned towards the middle of the road.
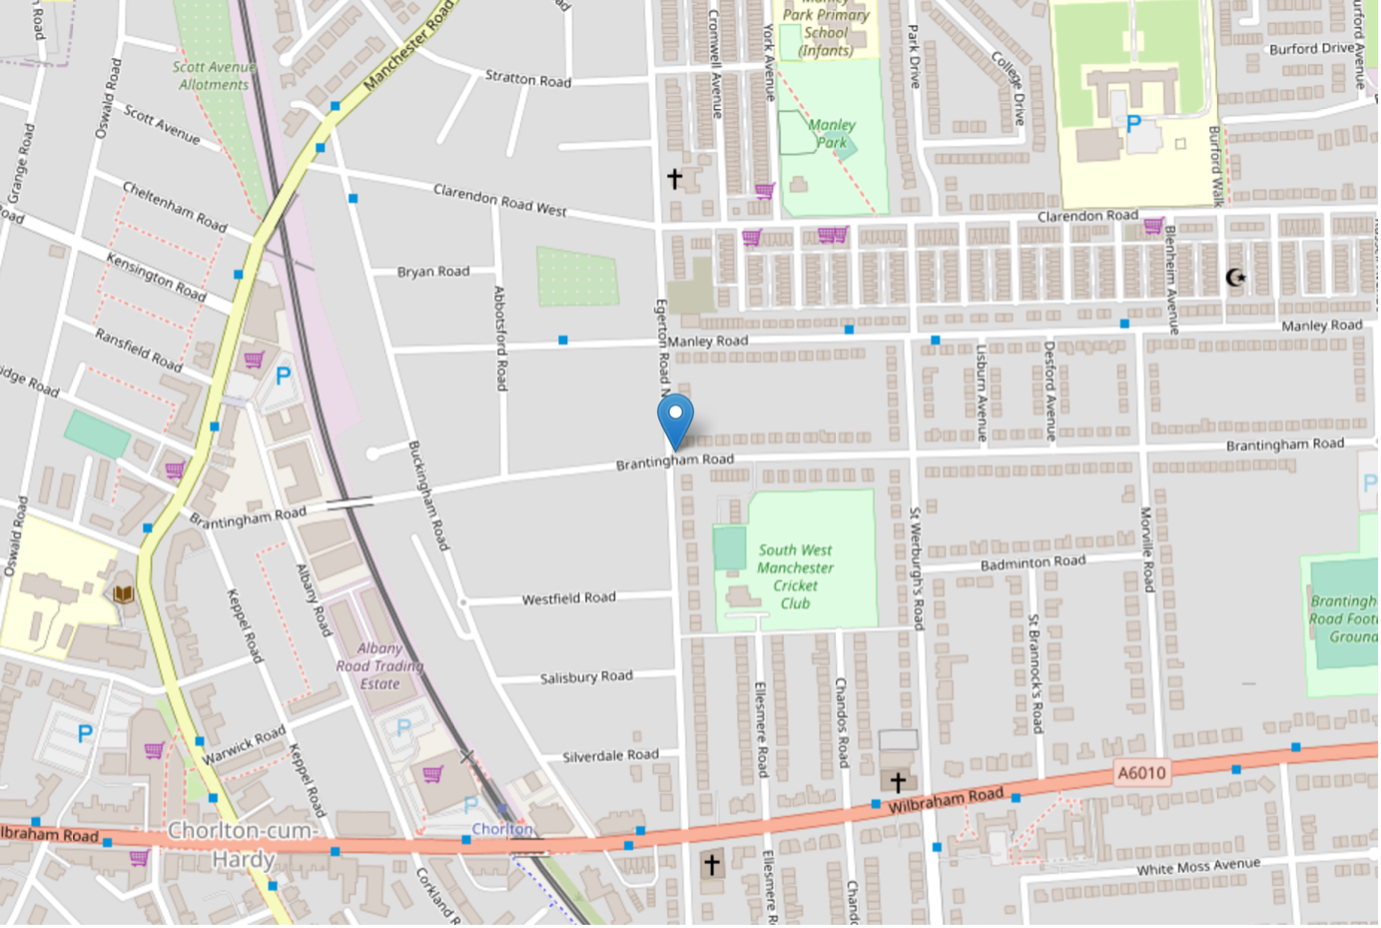
Source: OpenStreetMap
What we found
Looking at the total data count, we can see a peak in the number of cars recorded at 8am to 9am and 3pm to 5pm. These times correspond with the school run, and people travelling to and from work, and match similar patterns we’ve previously explored on other streets.
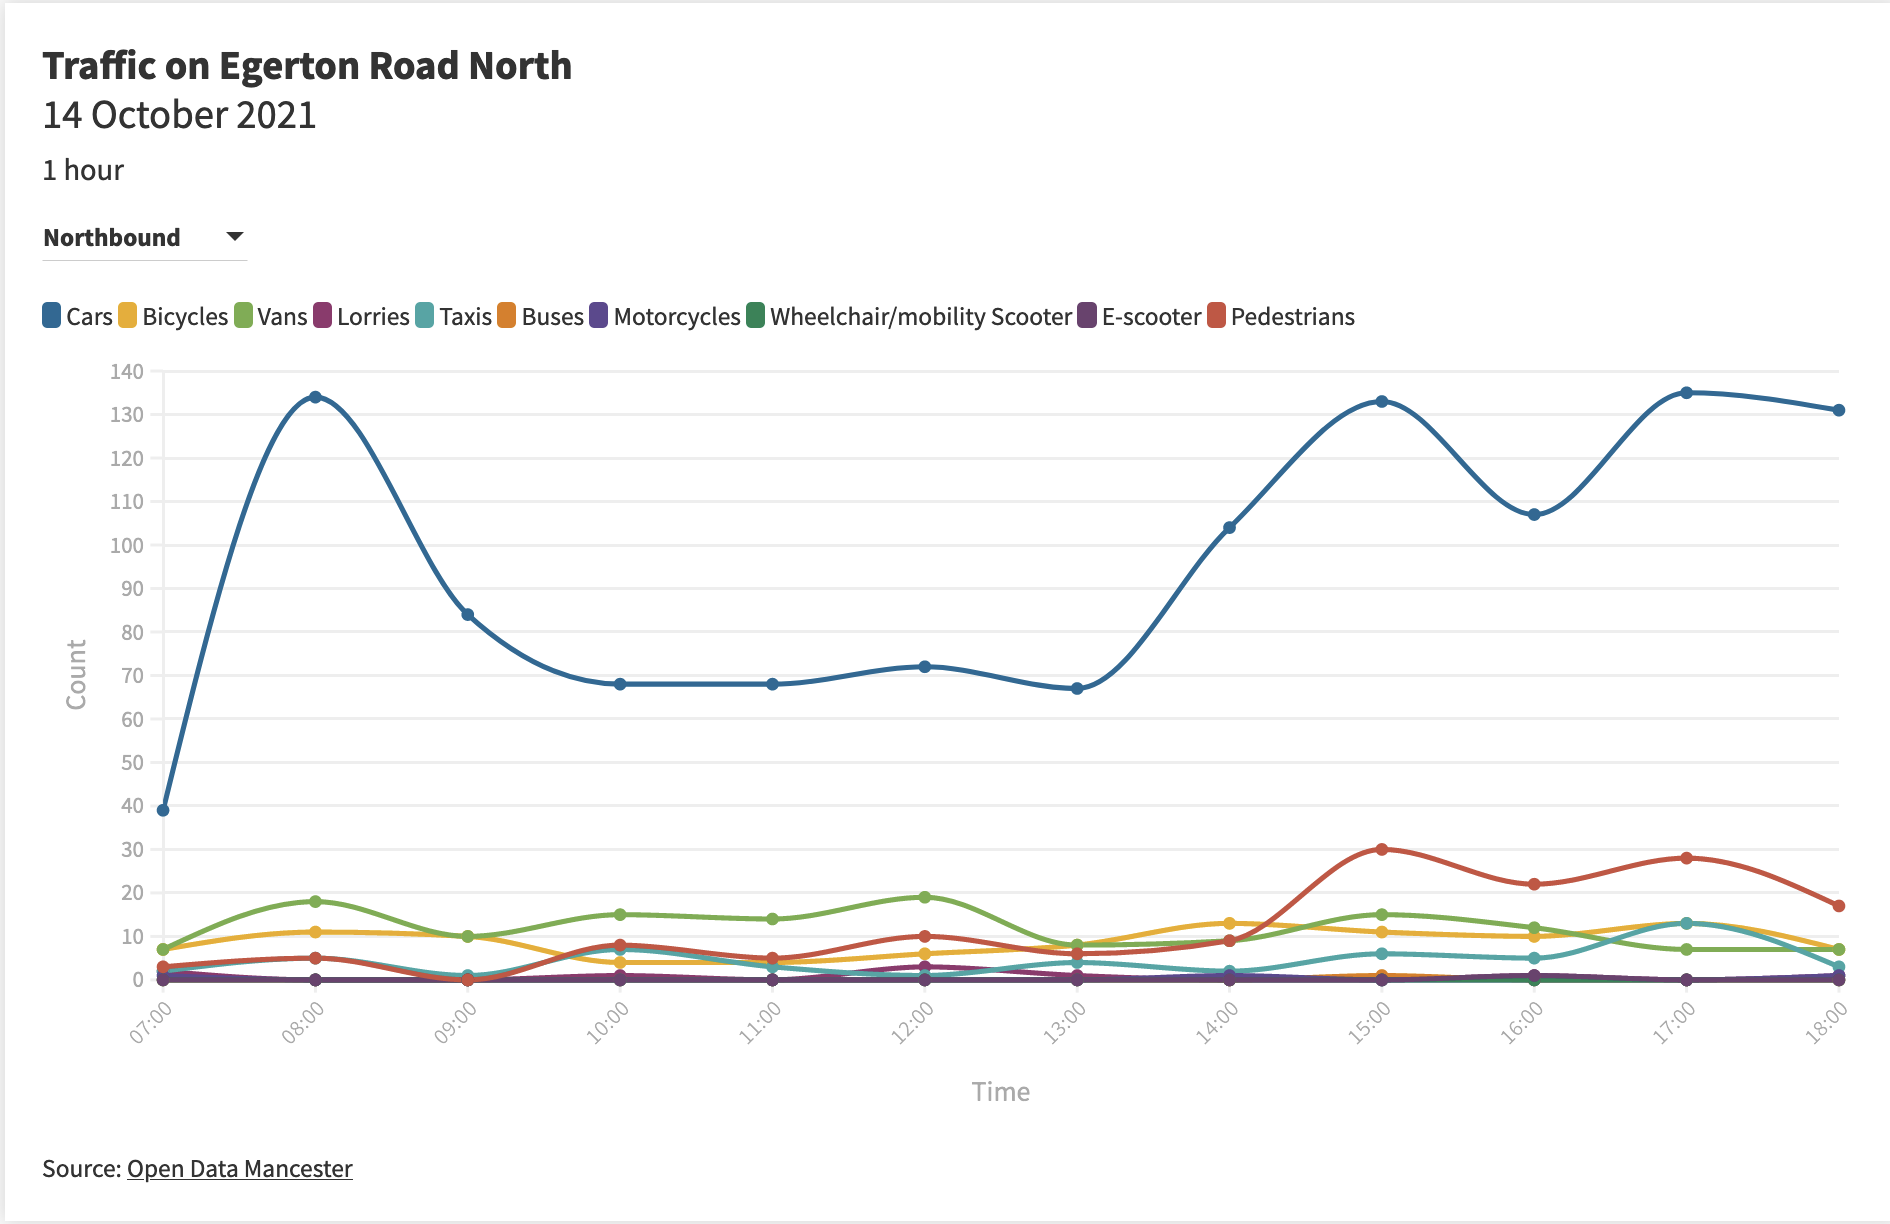
Image: Egerton Road North – 1 hour total
Unlike the count we carried out on Burrows Avenue, we can see the traffic is relatively equally matched when comparing north-bound and south-bound volumes.
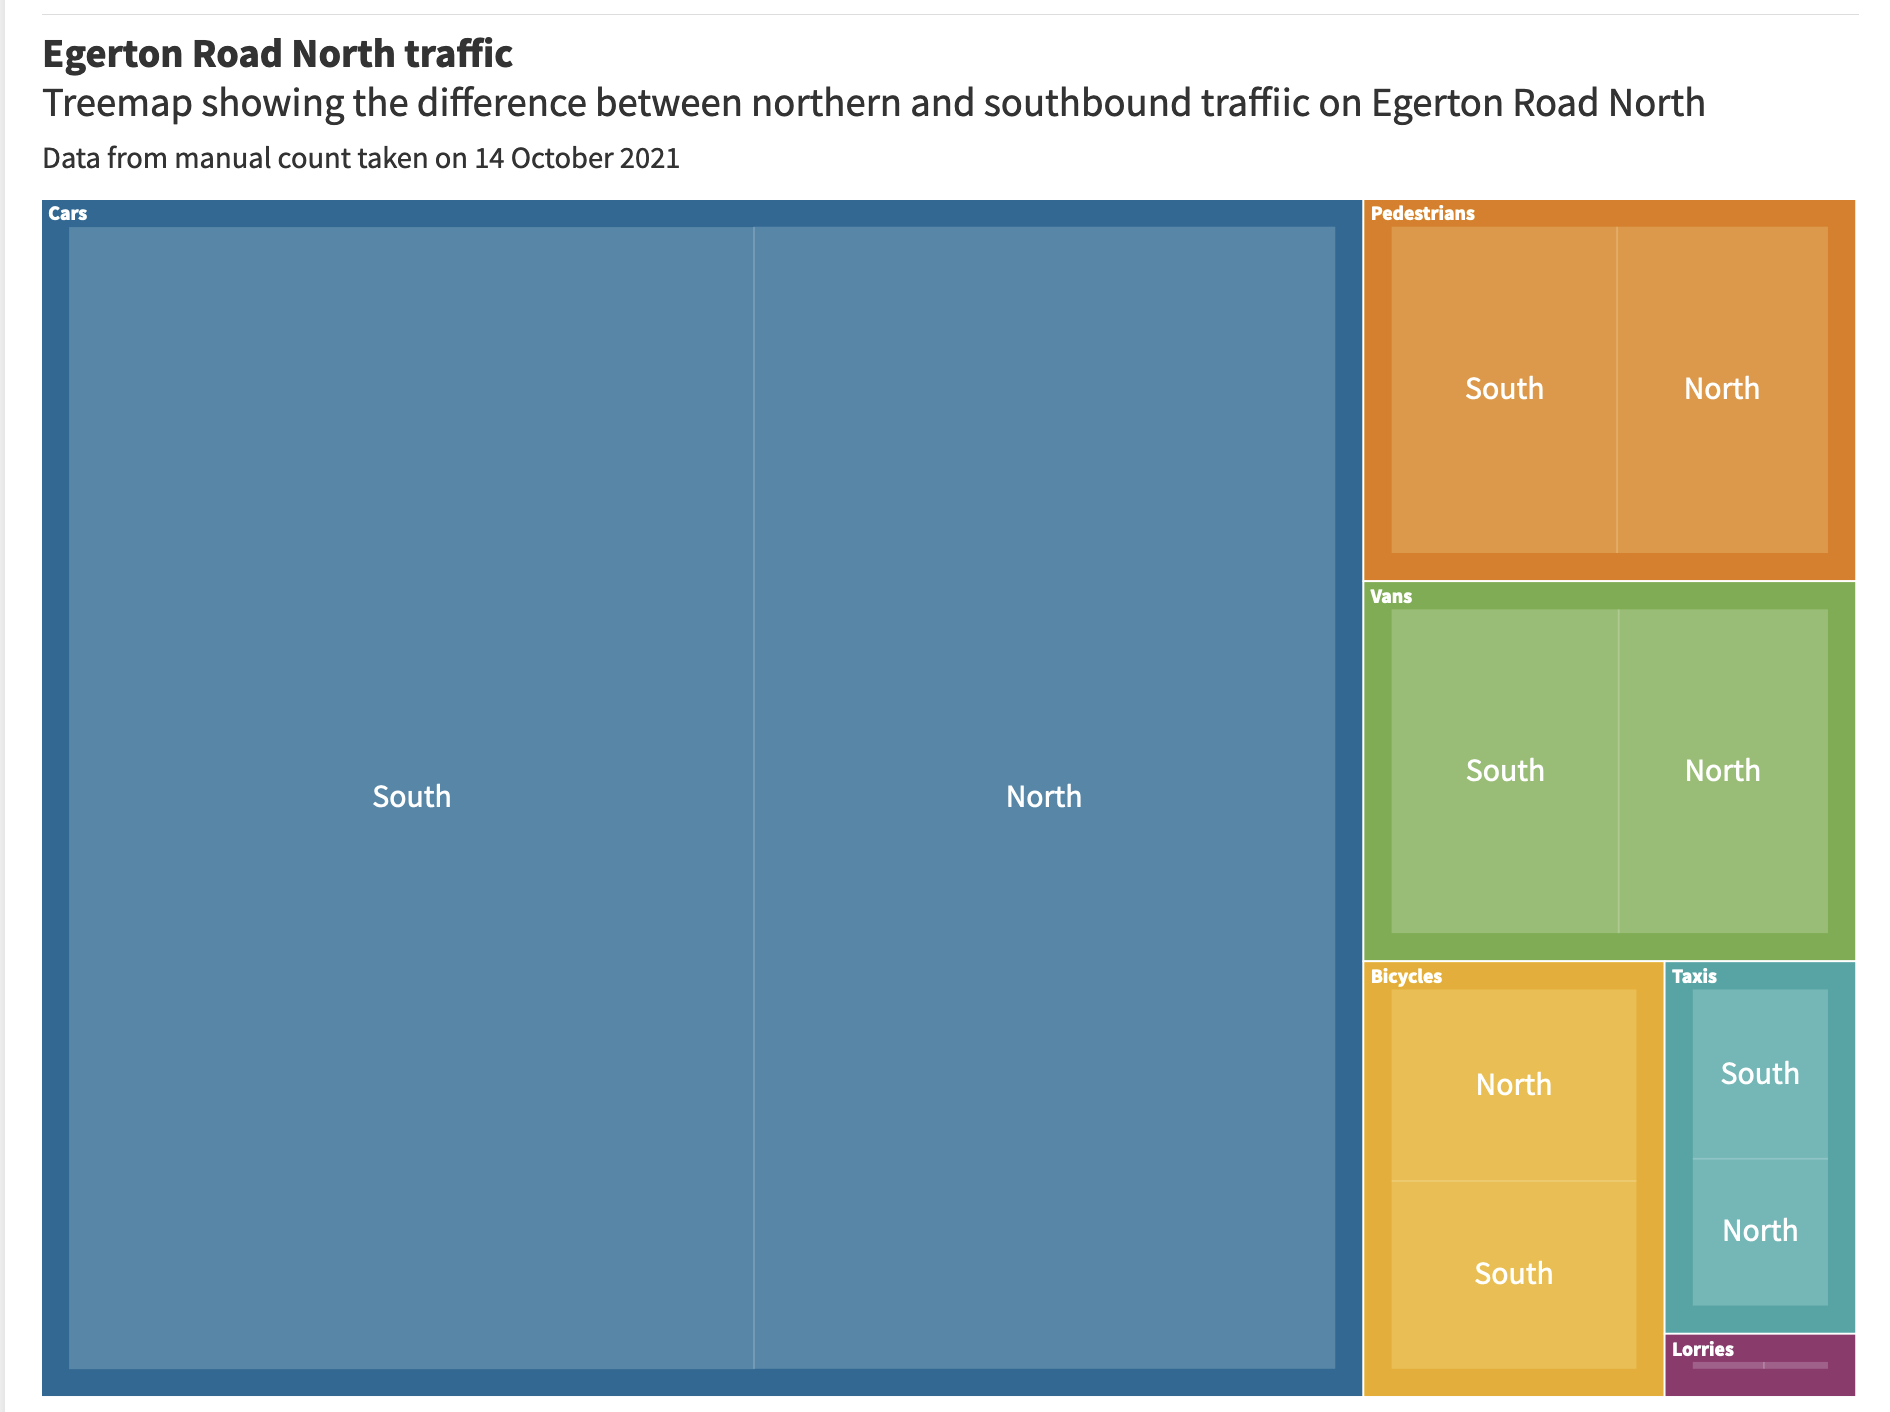
Image: Egerton Road North – Treemap
If we take out the cars counted, we can get a better look at the patterns for other modes of transport. For example, we see there is a peak of pedestrians moving southbound at 8am to 9am, and then northbound at 3pm to 4pm and 5pm to 6pm – this matches the school run, and the fact that there are a number of schools south of the chosen location.
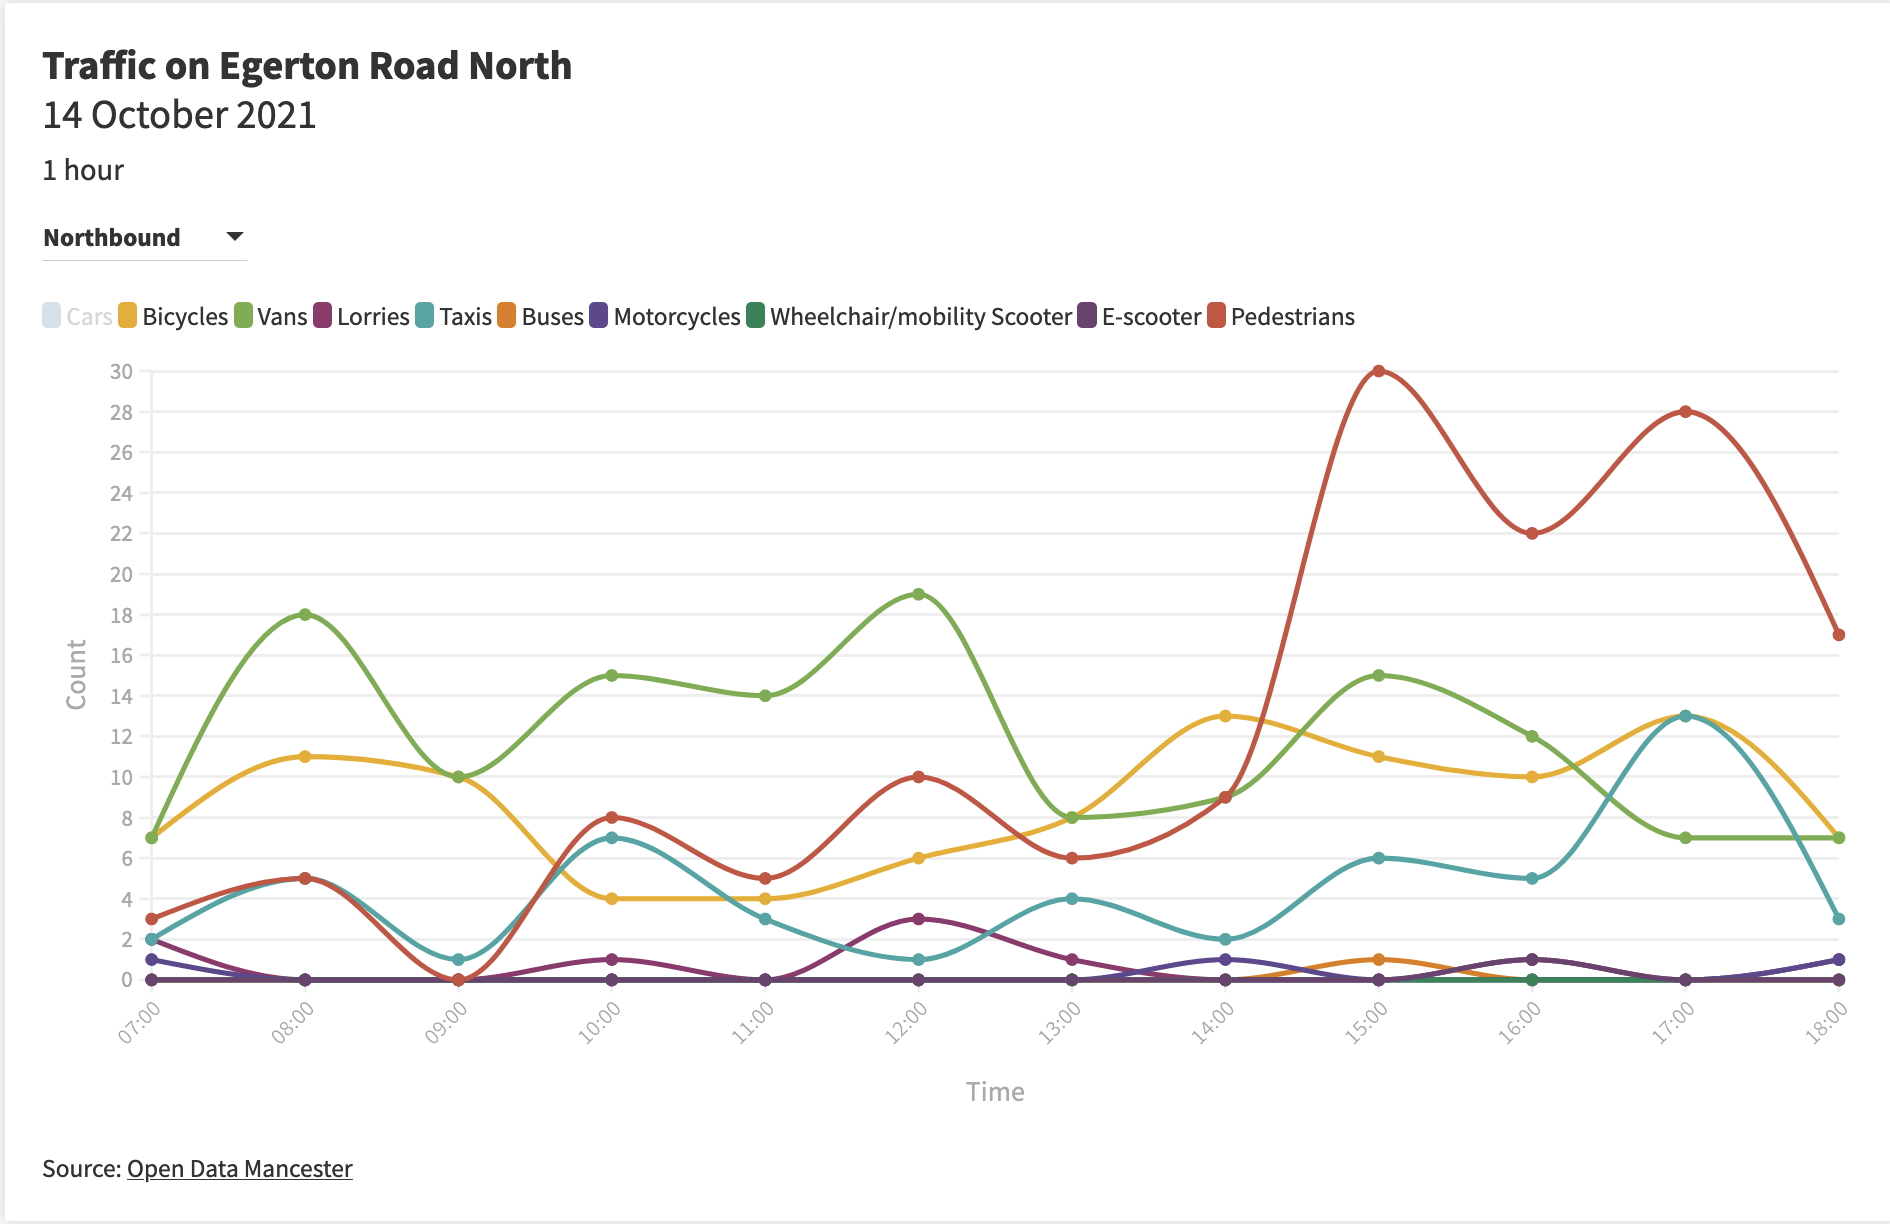
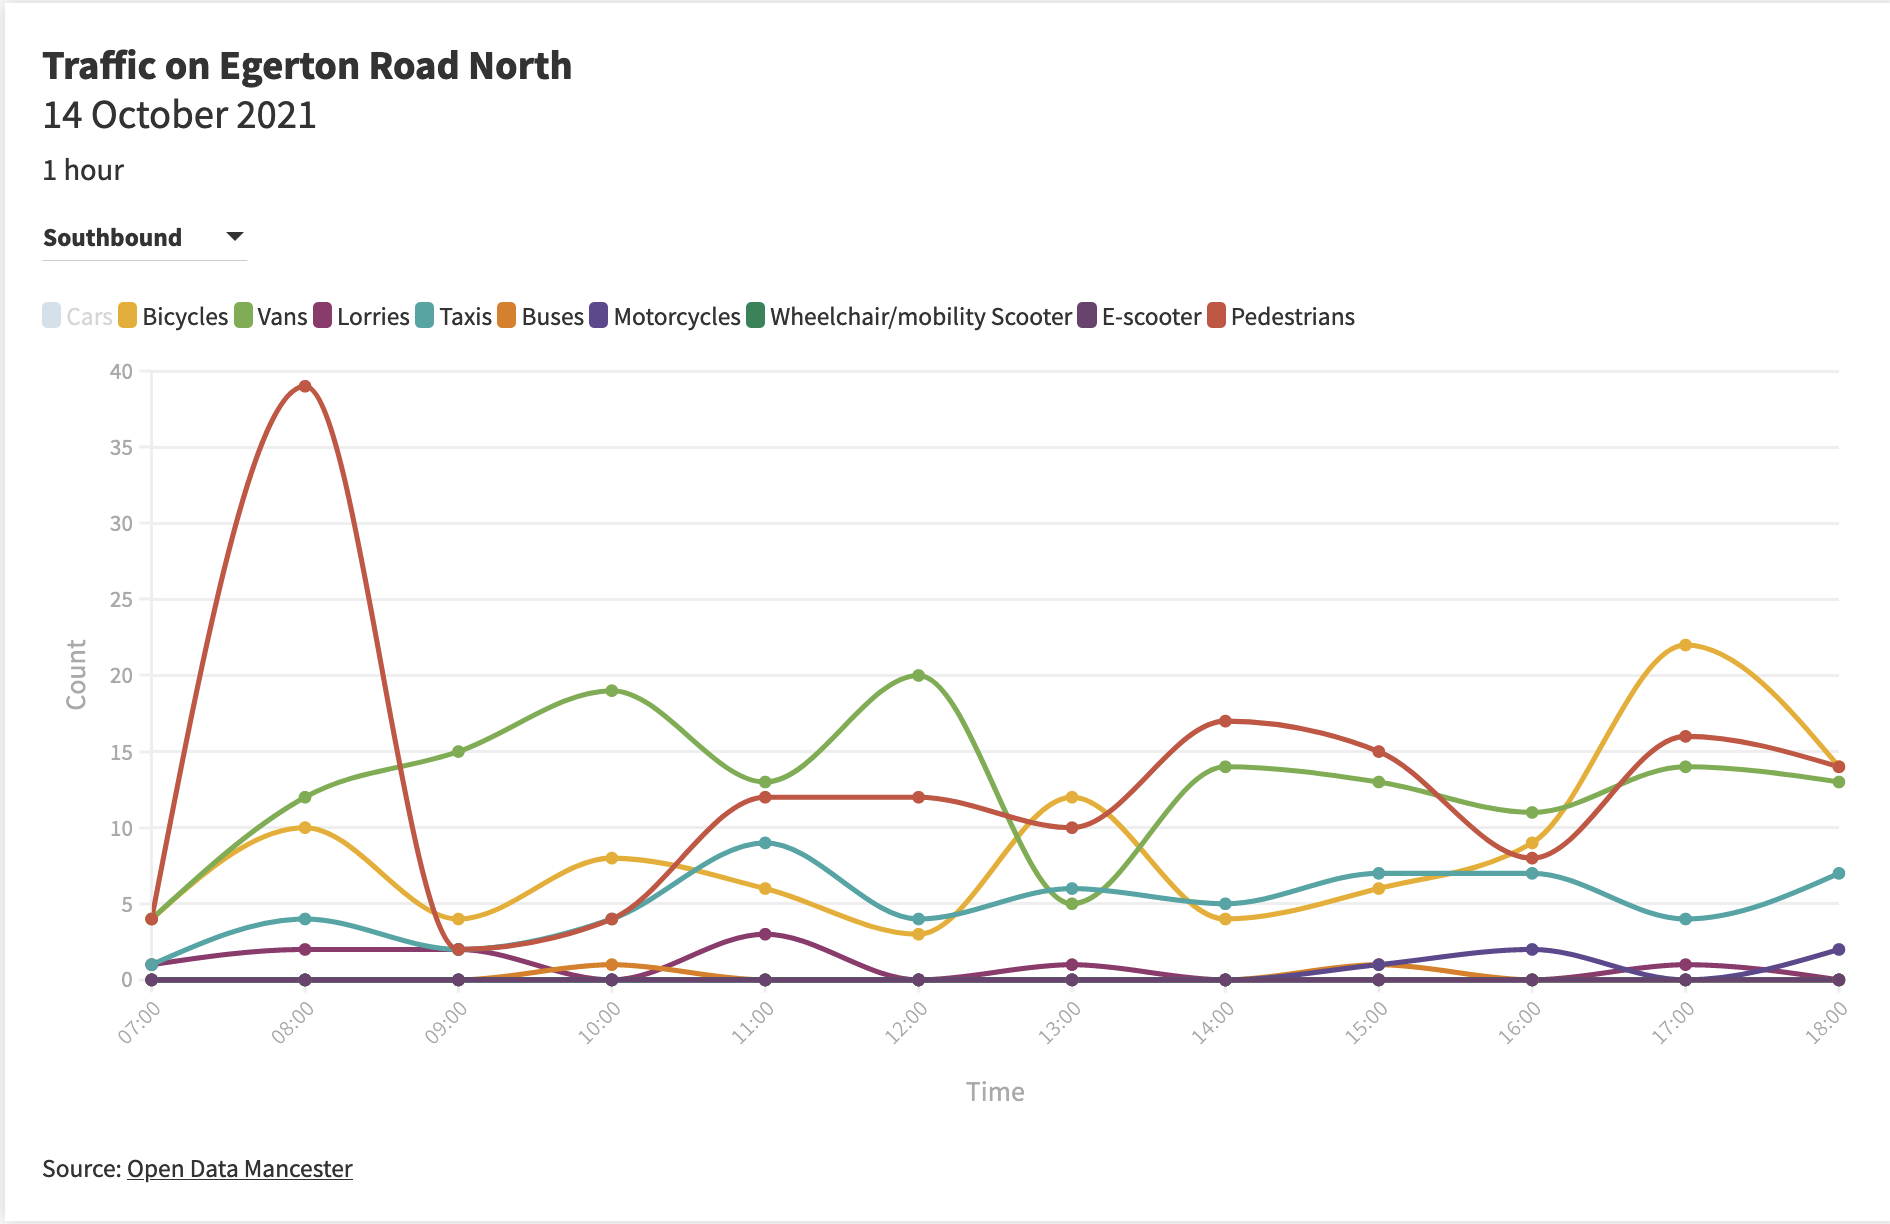
Although there are regular peaks and troughs throughout the day, we can also see that the road is used by van drivers pretty steadily throughout the day.
Egerton Road North compared to other roads
In order to better understand how Egerton Road North’s traffic levels compare to other roads, we took data from some active Telraam traffic counters in the area, including Oswald Road, St Werbergh’s Road, Kensington Road and Nell Lane.
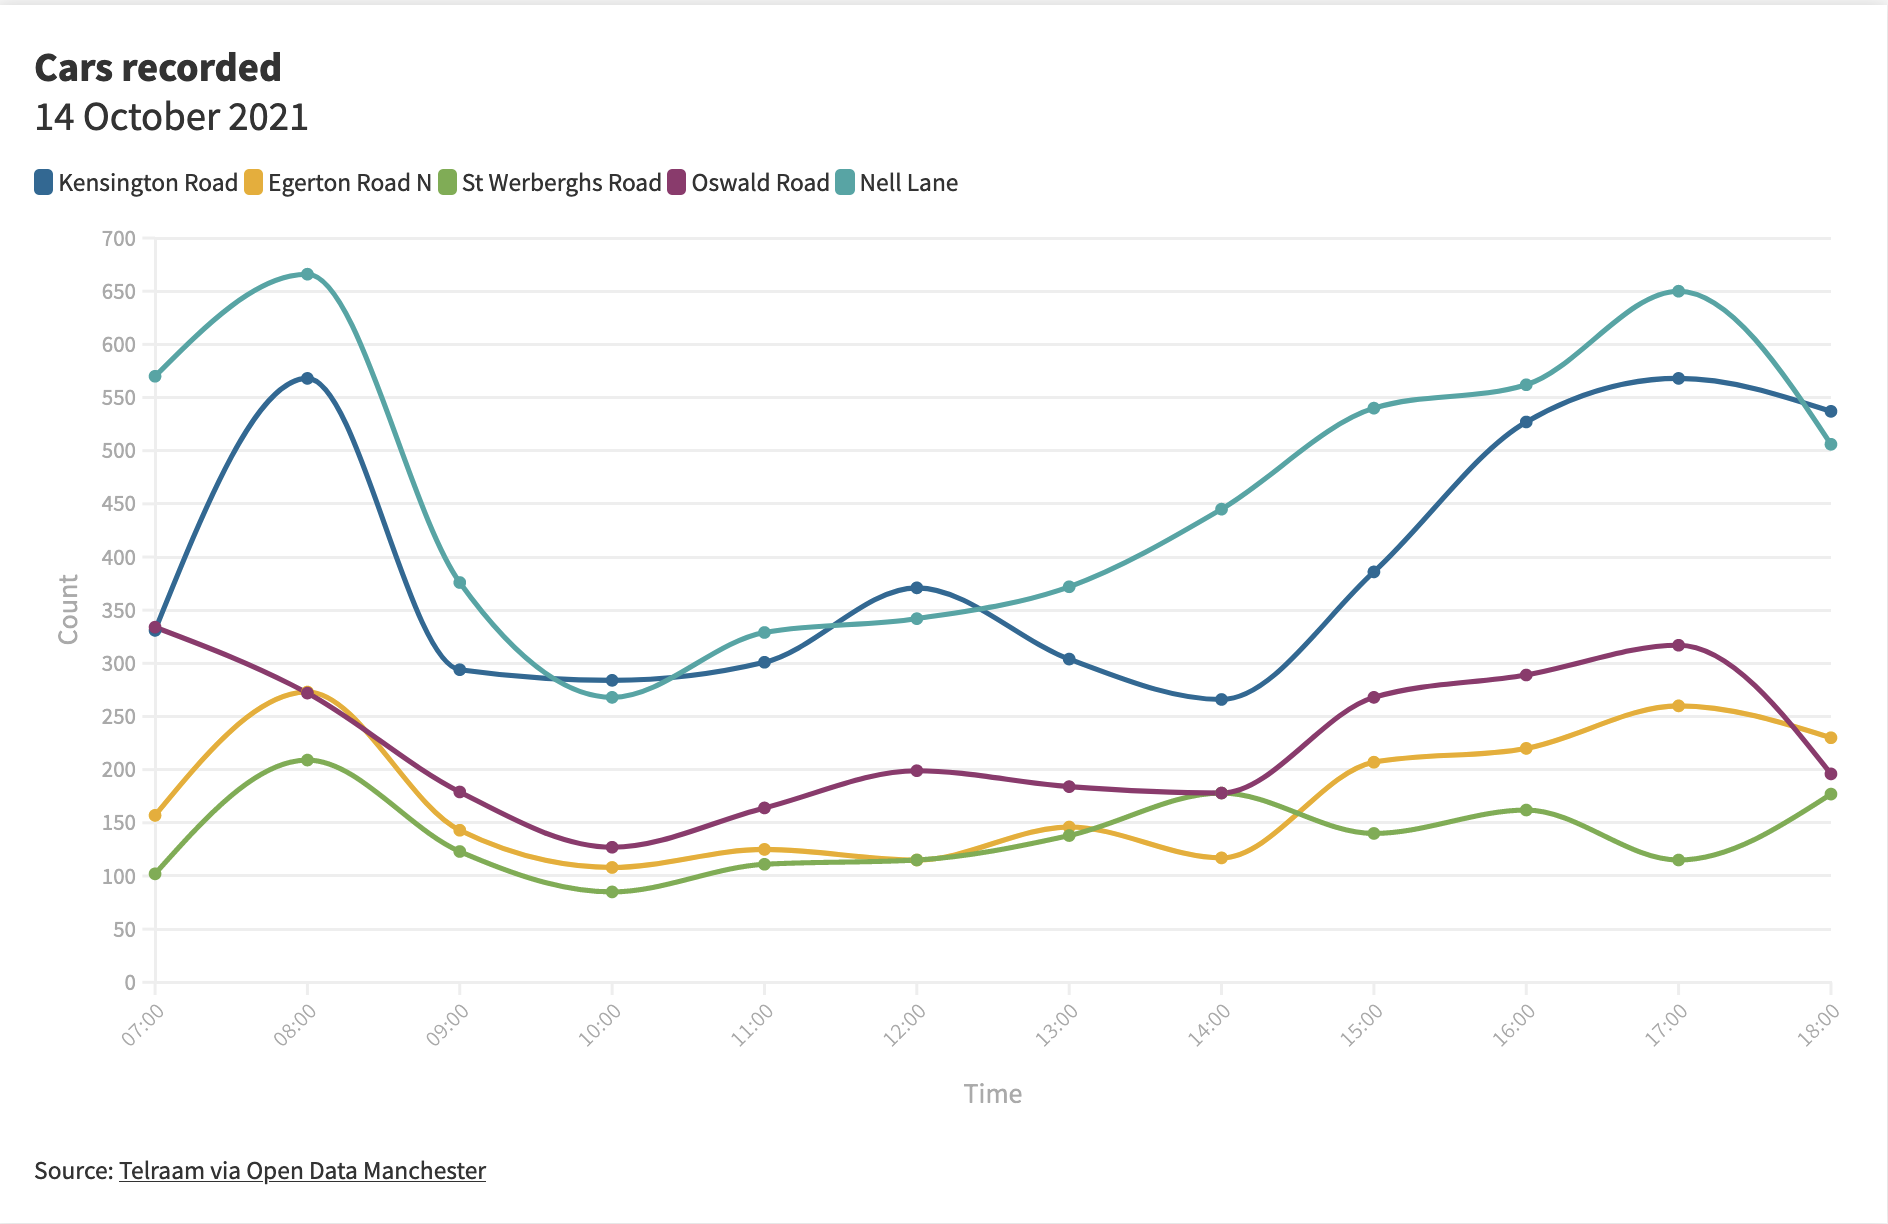
Image: Car levels compared
When comparing the data from 14 October at these five locations, we can see relatively similar patterns in the traffic flow, with peaks around 8am to 9am and between 3pm to 5pm. We can see that Kensington Road and Nell Lane record the highest volumes of cars, while Egerton Road North is comparable to Oswald Road and St Werbergh’s Road. This appears to suggest that traffic levels on Egerton Road North are not unusual compared to similar roads in Chorlton where we can access traffic data.
Impact of the school run and football matches
In previous ‘data chats’, we explored how the school run and Manchester United football games at Old Trafford affect traffic in Chorlton.
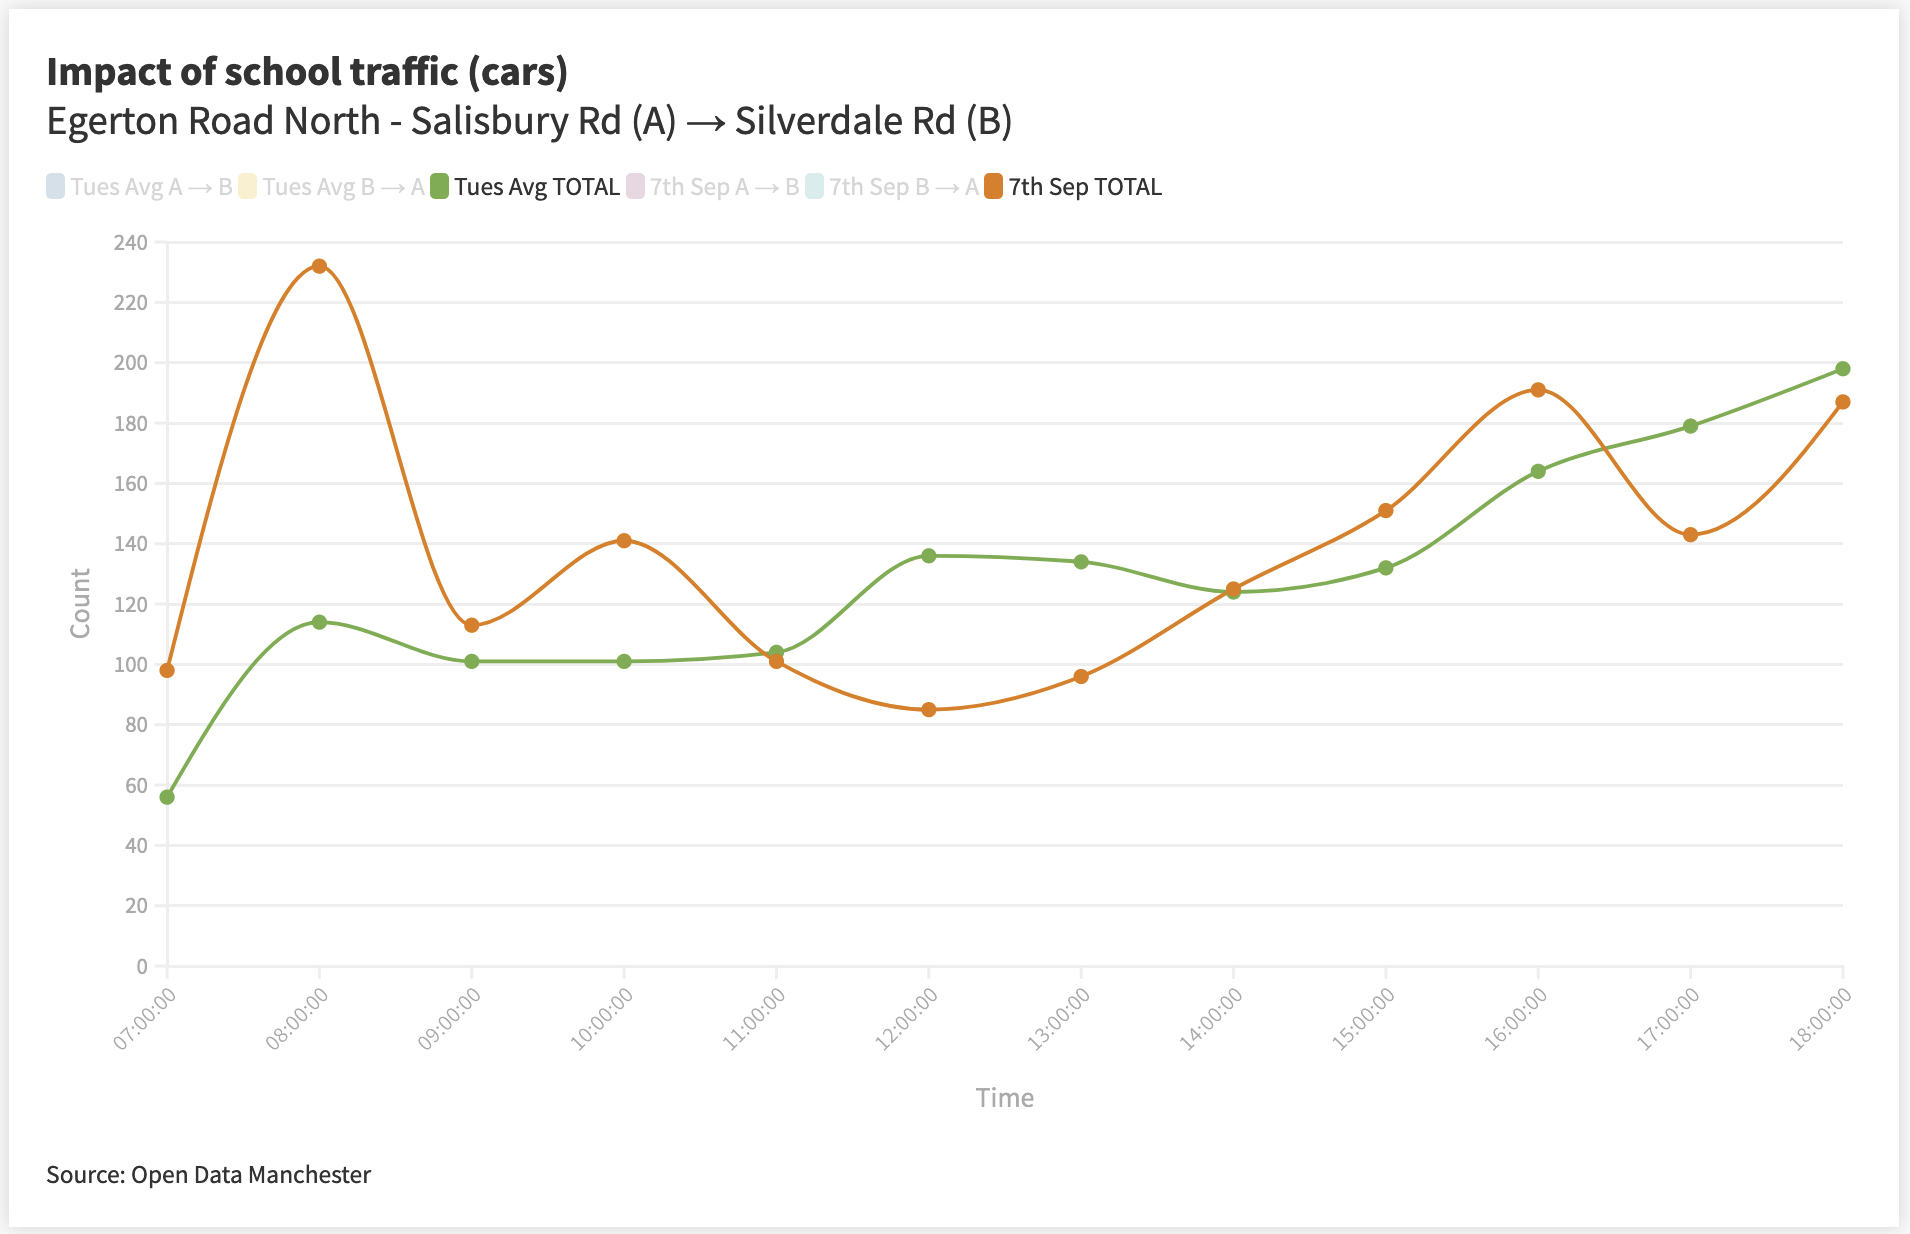
On Egerton Road North we can see here that the morning and afternoon peaks are not present during August when schools were closed for the summer. When schools reopened in September, we see the 8am to 9am and 4pm to 5pm peaks.
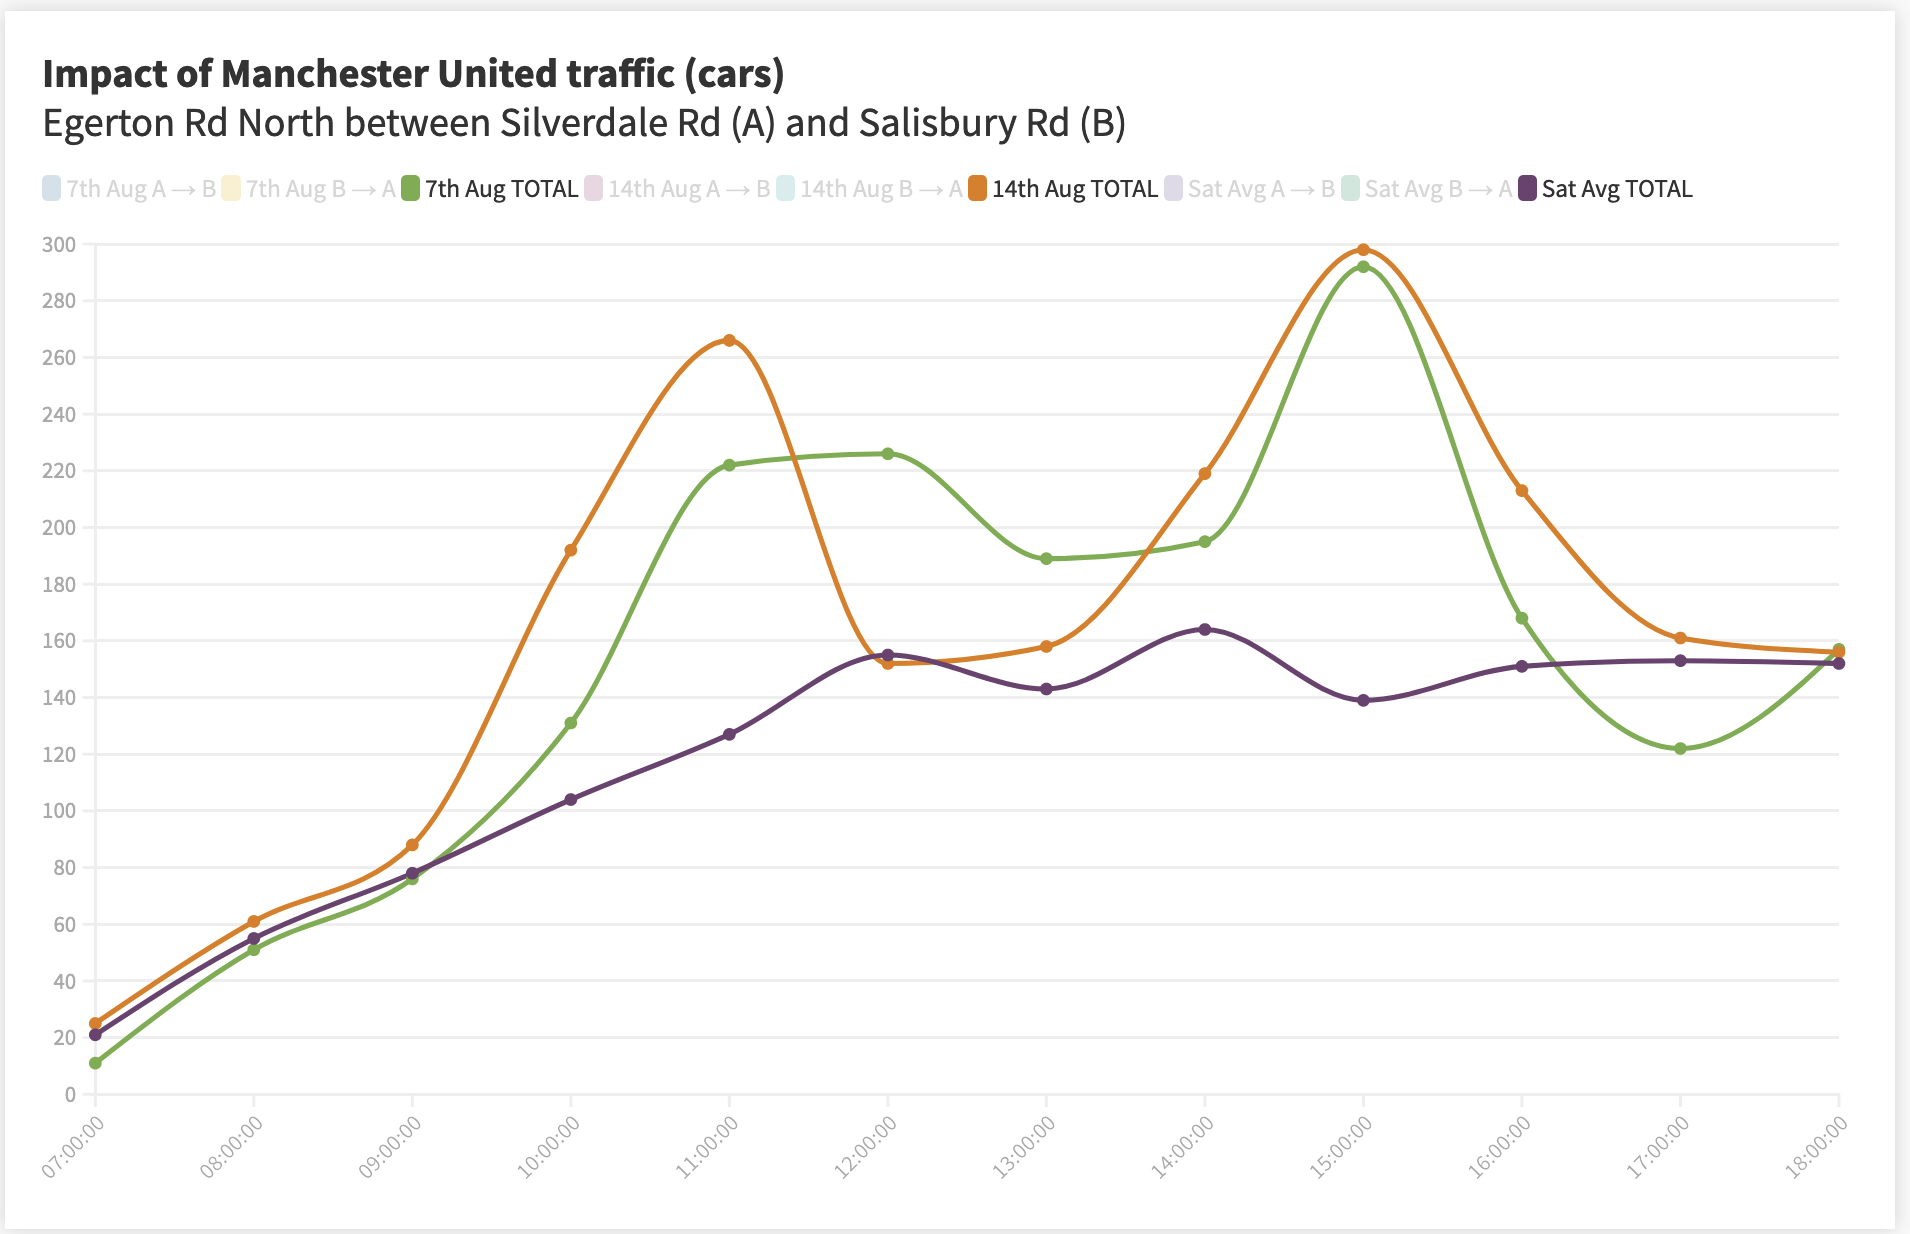
Likewise, looking at local match days, we are able demonstrate an increase in traffic before and after home football games at Old Trafford. Similar increases in road traffic were recorded at Oswald Road and Kensington Road, and you can explore these in more detail here.
To summarise
In terms of levels of traffic, we can see that Egerton Road North is not dissimilar to other roads in the area. It does, however, have lower volumes of traffic than others such as Kensington Road. Residents who attended the discussion said they would be interested in conducting their own counts, particularly in different locations on the street, to explore questions around whether the north end has higher or lower traffic than the south.
It was noted, both by residents, but also from the experience of our volunteers when conducting the count, that the speed of many vehicles seemed to exceed the 20mph limit. It might be recommended to pursue a speed test of the road where possible.
You can download the data or explore the interactive graphs yourself through the links below:
- Egerton Road North traffic graph – one hour
- Egerton Road North traffic graph – 15 minutes
- Egerton Road North – traffic by volume
- Impact of school run on Egerton Road North
- Impact of home football games at Old Traffic on Egerton Road North
- Cars on similar roads compared
You can download the data from the traffic count here.
Feel free to share any thoughts, findings, or questions over on the Open Data Manchester forum, send us a tweet or drop us an email. For more information on Our Streets Chorlton and how to get involved, visit the website or follow them on Twitter.