
As part of Our Streets Chorlton, Open Data Manchester has been carrying out data monitoring and collection, including local air-quality measurements and traffic surveys.
Each month, we get together with local people for a ‘data chat’, a friendly and informal exploration of some of the data the community has been collecting – to explore what it tells us, what it doesn’t – and dive into some of the questions we may have about it.
Over the past year, we have organised a number of resident-led, manual traffic counts carried out by volunteers we’ve trained from the community, and on 16 September 2021, they gathered on Burrows Avenue, a relatively small residential street on the Merseybank Estate in the Chorlton Park ward.
For our October data chat, we took a look into the results of this count.
Residents of Burrows Avenue had been in contact with Our Streets Chorlton after seeing the school-street closure and previous traffic counts done on Darley Avenue with Barlow Hall Primary School.
They were concerned that the road was becoming a local ‘rat run’ – used either to avoid the traffic lights at the Barlow Moor Road tram stop or the speed bumps on Darley Avenue.
They told us they felt there were more cars using the road than they expected and there had been a number of accidents caused by drivers using it as a through-road. With a primary school just around the corner, and a patch of green space where children play and people walk dogs, residents wanted to explore what the road might be like if traffic were more controlled.
The Our Streets Chorlton team agreed to help Burrows Avenue residents organise a three-day street closure at the end of September. Alongside this, Open Data Manchester organised its Data Champions to conduct a manual traffic count – so that residents could get a better understanding of traffic on their street – and to see if there was evidence for such a local ‘rat run’.
What we did
For the community-led traffic counts, we try to collect data to match Department for Transport road-traffic counts. But as a result of some co-design workshops we ran earlier in the year, we also count extra categories including pedestrians, wheelchairs and e-scooters.
Traffic is counted from 7am to 7pm, with the day divided into one-hour shifts, with two volunteers counting one direction of travel each. A third person, a member of the Our Streets Chorlton team, is also on hand to offer support to the counters and speak to the public where needed.
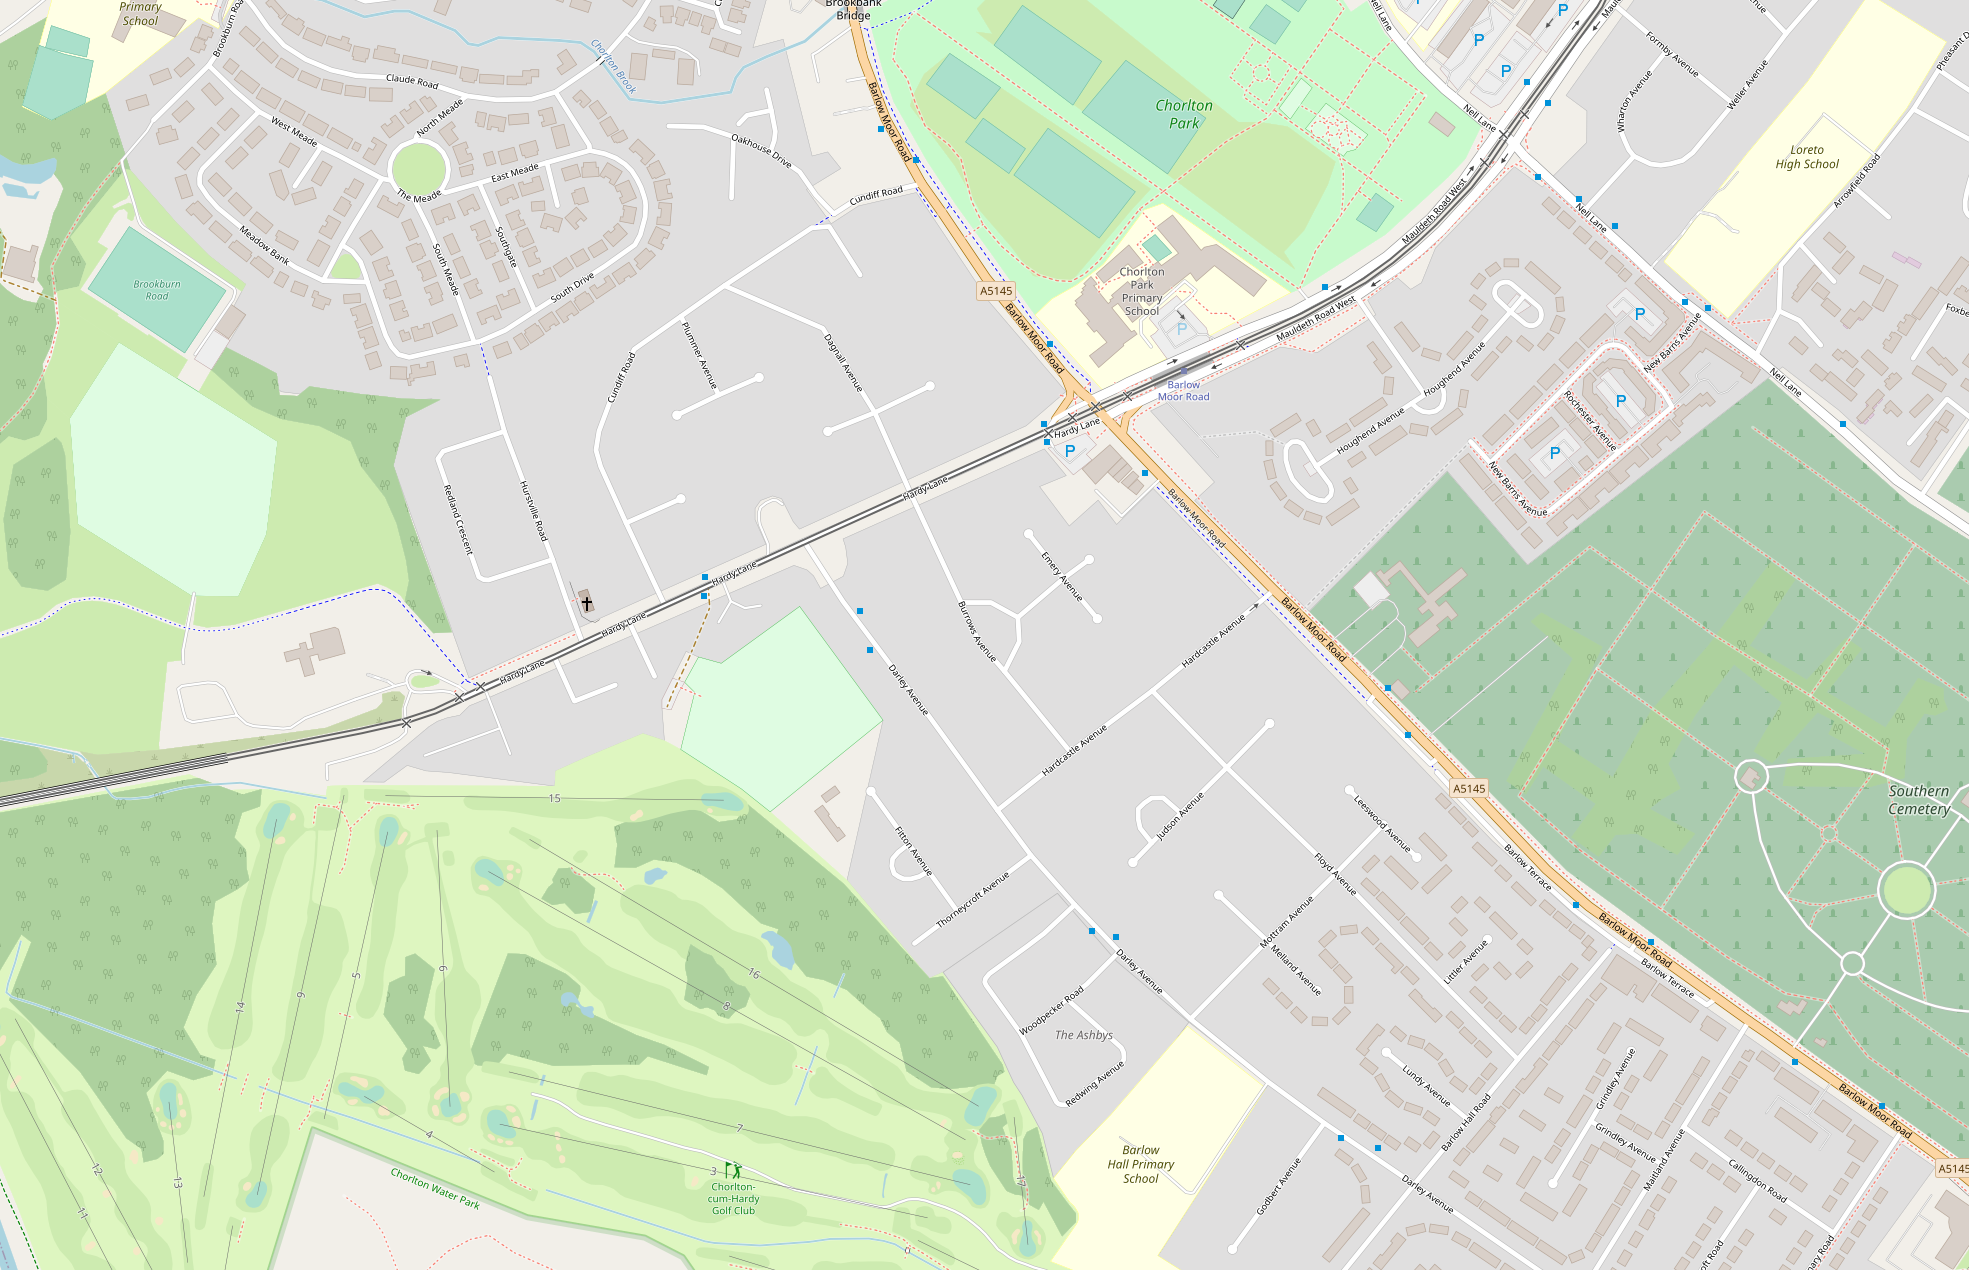
Burrows Avenue itself is relatively quiet residential street in the Merseybank Estate. It sits between Darley Avenue – which has Barlow Hall Primary School on it – and Barlow Moor Road, which is a busy ‘A’ road that leads in and out of central Chorlton and towards Manchester city centre.
Because of the traffic lights at the Barlow Moor Road and Mauldeth Road West junction, it is believed that drivers often divert through the estate. Although nearby Darley Avenue is a wider, longer through-road option, it also contains a number of speed bumps, so residents believe that Burrows Avenue is also used to avoid these.
What we found
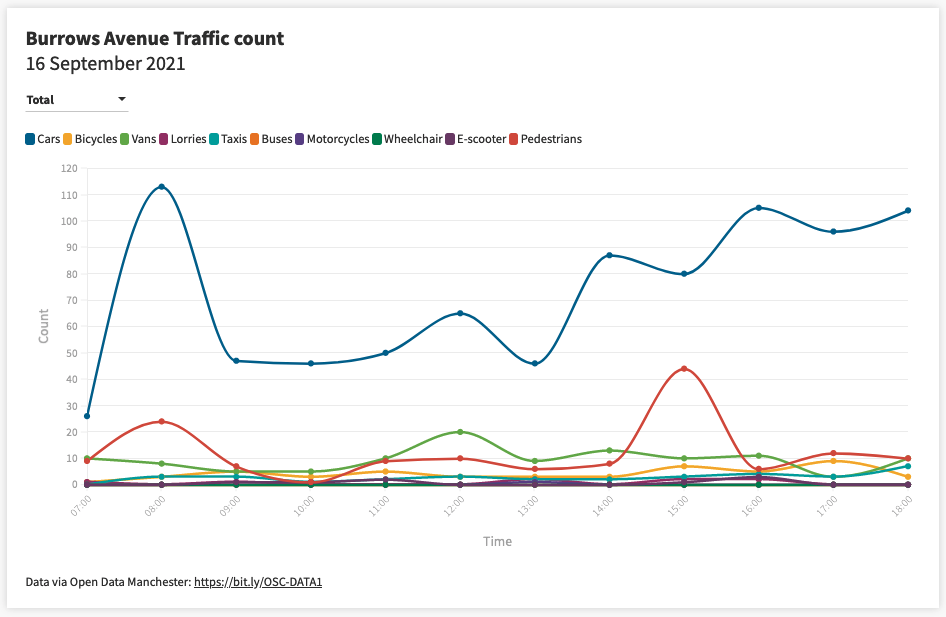
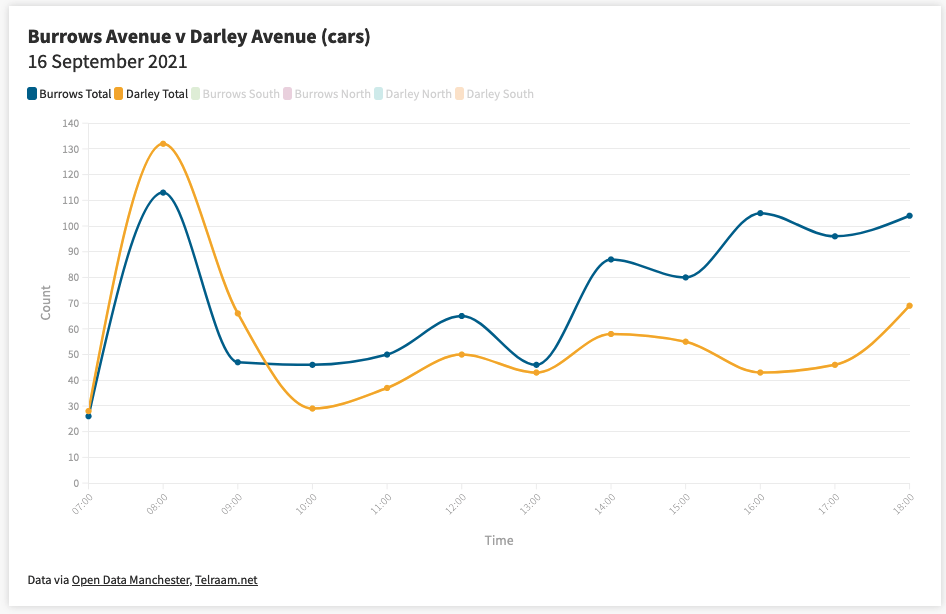
When looking at the total data collected from the count, we can clearly see a peak in the number of cars between 8am to 9am and 2pm to 4pm, which corresponds with the school run – and we regularly see similar patterns on other school streets.
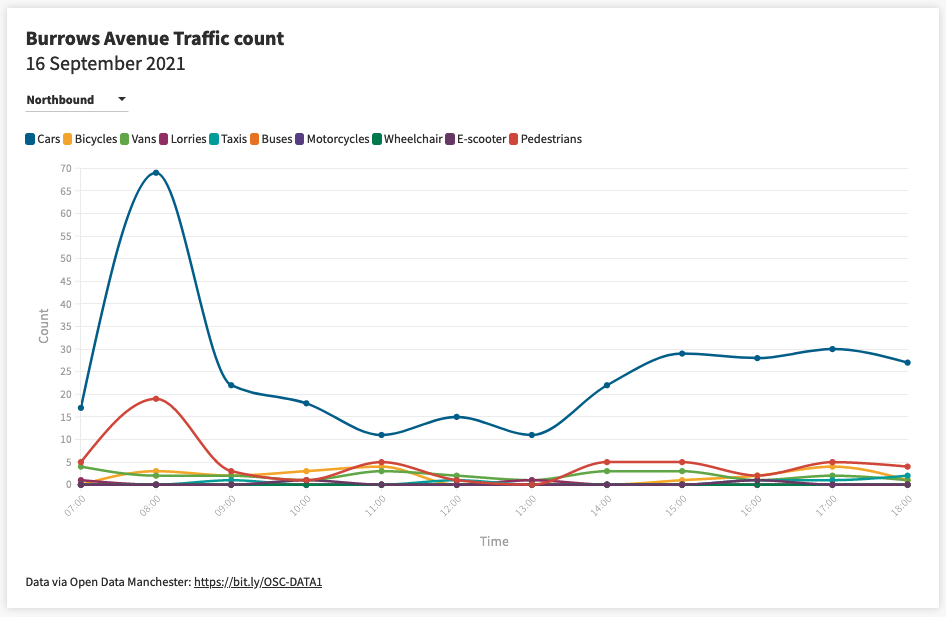
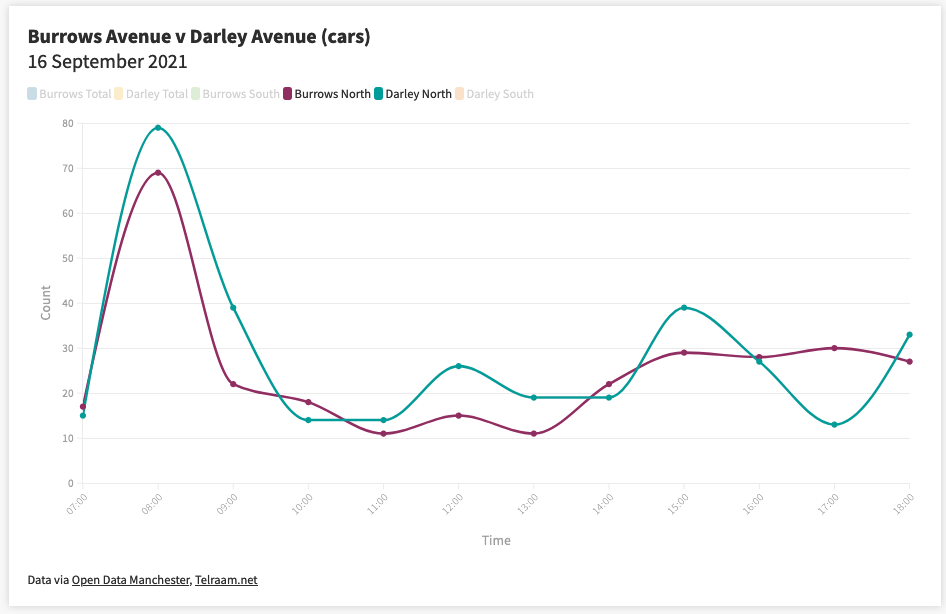
However, when we look at north- and south-bound traffic separately, we can see a clear difference. North-bound traffic shows a peak at 8am to 9am, of 69 cars recorded, with the second-highest hour being 5pm to 6pm, with 30 cards recorded.
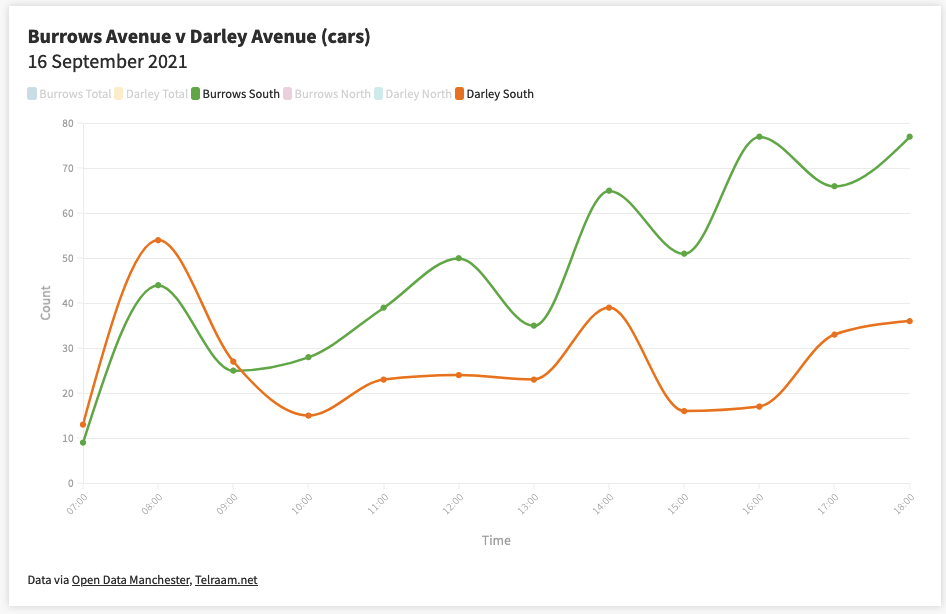
When we compare this with south-bound traffic, we see a steady increase throughout the day. We still see an 8am to 9am peak of 44 cars, but with further, larger spikes later during the day – peaking at 4pm to 5pm and 6pm to 7pm, with 77 cars recorded respectively.
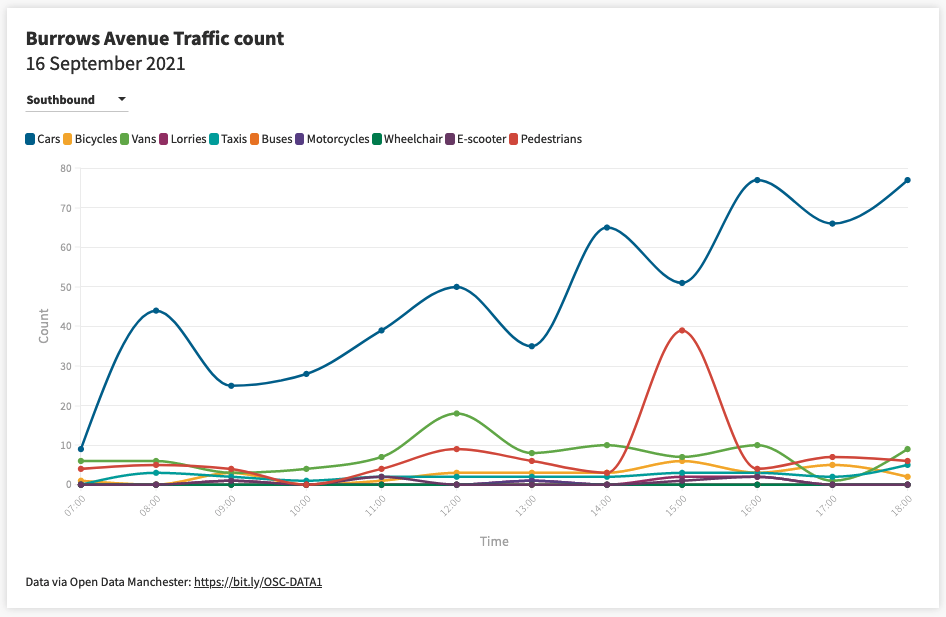
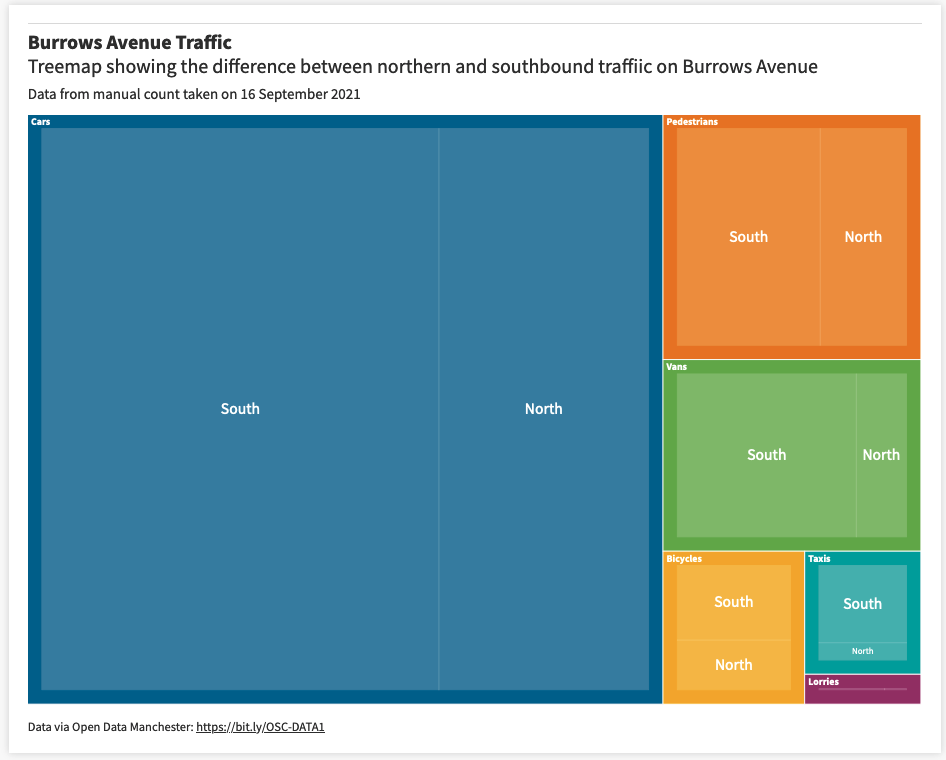
In short, south-bound traffic got noticeably busier as the day went on and, when we look at the totals for the day – we see about twice as many cars and four-times as many vans travelling south compared to north.
One hypothesis for this is that drivers use Burrows Avenue to avoid the speed bumps on Darley Avenue.
For the wider project, we have an automated Telraam traffic counter placed on Darley Avenue measuring traffic parallel to Burrows Avenue – and a quick comparison of this data from the same day shows that Burrows Avenue does appear to be busier than Darley Avenue.
Where both Darley Avenue and Burrows Avenue show similar patterns in car traffic travelling north-bound, and have similar peaks at 8am to 9am south-bound, we can see that Darley Avenue doesn’t have the same increase in south-bound traffic that Burrows Avenue displays, which may indicate a local ‘rat run’.
NOTE: it’s worth bearing in mind that, although this is a comparison of data from the same day, the Telraam data for Darley Avenue and the traffic count on Burrows Avenue were collected using different methods – so these should be used as an indication of traffic flow only.
A couple of residents local to Burrows Avenue attended the data chat and said they weren’t surprised to see the graphs back up their experience of the road, but they were surprised at just how different the north- and south-bound data was.
One thing that we weren’t able to measure was traffic speed – but it certainly felt to residents and our volunteers alike that many were exceeding the 20mph limit – and we’d recommend this to be explored further.
From their experience, residents felt that Burrows Avenue was being used to avoid busier roads, a local ‘rat run’ – and the data collected from our traffic count certainly seems to illustrate that something to this effect appears to be going on – especially when compared to data from parallel roads.
You can download the data or explore the interactive graphs yourself through the links below:
- Burrows Avenue traffic count graph – one hour
- Burrows Avenue traffic count graph – 15 minutes
- Burrows Avenue tree map – traffic by volume
- Burrows Avenue versus Darley Avenue graph – cars
- Burrows Avenue traffic count data – Github
Feel free to share any thoughts, findings, or questions over on the Open Data Manchester forum, send us a tweet or drop us an email. For more information on Our Streets Chorlton and how to get involved, visit the website or follow them on Twitter.