As part of Our Streets Chorlton, Open Data Manchester has been carrying out data collection and monitoring, including taking air-quality measurements and doing traffic surveys. We’ve been using this to create monthly environmental data bulletins that showcase some of the local data being collected for the project.
For these bulletins, we’ve been including a localised Air Quality Index (AQI) based upon the readings of our two EarthSense Zephyr air quality monitors – more on those here.
Below we explain a little bit about air pollutants and how we created our own index.
The air we breathe
The atmosphere of Earth, commonly known as air, is a mixture of gases and particles that see both seasonal variation and change depending on the local environment. Generally dry air is made up of:
- Nitrogen (N2) – 78.084%
- Oxygen (O2) – 20.946%
- Argon (Ar) – 0.934%
- Carbon dioxide (CO2) – 0.0416%
- Neon (Ne) – 0.001818%
- Helium (He) – 0.000524%
- Methane (CH4) – 0.000187%
- Krypton (Kr) – 0.000114%
When talking about ‘air quality’, we are concerned with the concentrations of additional harmful pollutants in the air, which are produced through both human and natural activity.
Additionally, there are a number of gases in our atmosphere called ‘greenhouse gasses’, which can prevent heat from escaping into space and contribute to global warming. These are primarily:
- water vapour (H20)
- CO2
- CH4
- nitrous oxide (NO2)
- ozone (O3)
What we measure as part of Our Streets Chorlton
During the Our Streets Chorlton project, we have placed two Earthsense Zephyr air-quality monitors at different locations to measure the amount or concentration of pollutants in the local atmosphere, so we can track how these change over time.
Concentrations of pollutants are often measured in micrograms (one millionth of a gram or “µg”) per metre cubed (m³), represented as µg/m3.
Particulate matters (PM), such as soot from the burning of fuel and vehicle exhausts, are categorised by size and measured in micrometres µm (a millionth of a metre – the width of a single human hair measures from 20-200µm).
The pollutants we’ve measured are:
- Nitrogen monoxide, also known as nitric oxide (NO)
- Nitrogen dixoxide (NO2)
- Ozone (O3)
- Particulate matter by size:
- PM1 – particles less than 1µm in width
- PM2.5 – particles less than 2.5µm in width
- PM10 – particles less than 10µm in width
One pollutant that we aren’t measuring is sulphur dioxide (SO2) – which is often a by-product of burning coal or oil in power stations – and in large concentrations, along with NO, produces acid rain.
As well as these pollutants in the air, we’ve also been measuring the temperature and humidity at our locations, as these have an effect on the pollutants present and can also tell us things about the local environmental conditions.
A bit about the pollutants
NO and NO2 are produced when nitrogen and oxygen react. This can be as a result of combustion, such as from car engines. When NO2 is exposed to sunlight, it can split, releasing an oxygen ion that can contribute to the creation of O3.
Looking at our own measurements, we do tend to see that NO and NO2 levels drop during the day time and O3 levels increase, consistent with the reaction described here.
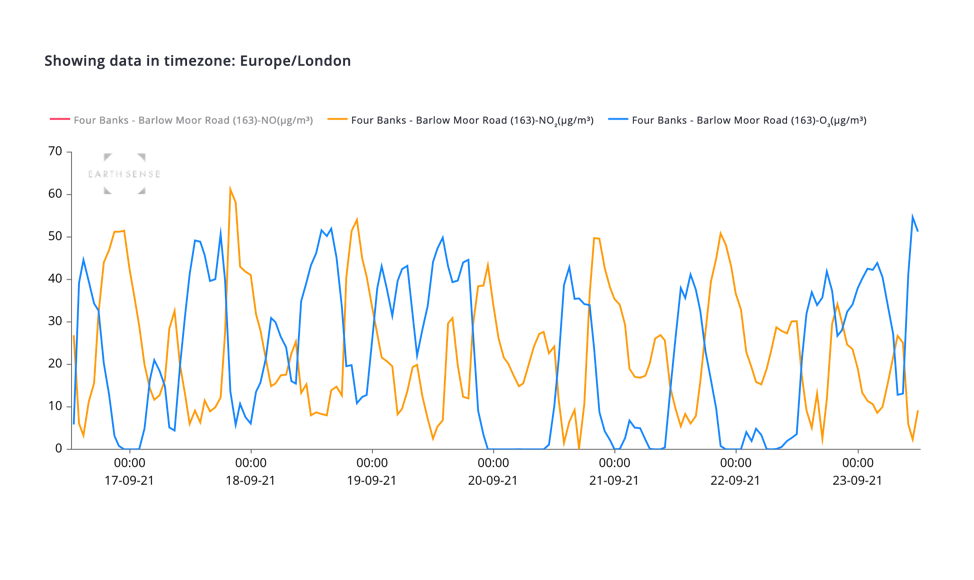
Fig 1: There is an inverse correlation (when one goes up the other goes down) between NO2 (yellow line) and O3 (blue line). Measurements taken from Four Banks, Chorlton, Manchester, 17/09/2021-23/09/2021.
While O3 helps to protect us from ultraviolet radiation when in the Earth’s stratosphere, at ground level it can be toxic and damaging to health. O3 is also a key ingredient in smog!
PMs describe the mixture of liquid and solids found in the air, of things like dust, ash and soot. These are all different sizes and so are the measurements. The smaller the particle, the deeper they can travel into our lungs and so they are known to aggravate respiratory conditions such as asthma, as well as affecting the cardiovascular system and being linked to cognitive decline.
Emissions from car exhausts and residential heating, such as wood burning stoves, increase the number of particulates in the air.
Getting to grips with measuring air quality
There are different air-quality indexes out there, but in the UK, the most commonly used one is the Department for Environment, Food and Rural Affairs’ (Defra) Daily Air Quality Index (DAQI).
This index is based on concentrations of five air-borne pollutants – NO2, SO2, O3, PM2.5 and PM10. Measurements of these are combined in a certain way (more on that below) and then an overall score is given.
The score is rated on a scale of 1-10 (where 1 is low and 10 is high) and these are in turn divided into four bands (Low, Moderate, High and Very High).
This is then used to create air-quality forecasts and provide health advice, particularly to people in at-risk groups, such as those with asthma, who may want to avoid highly polluted areas or days.
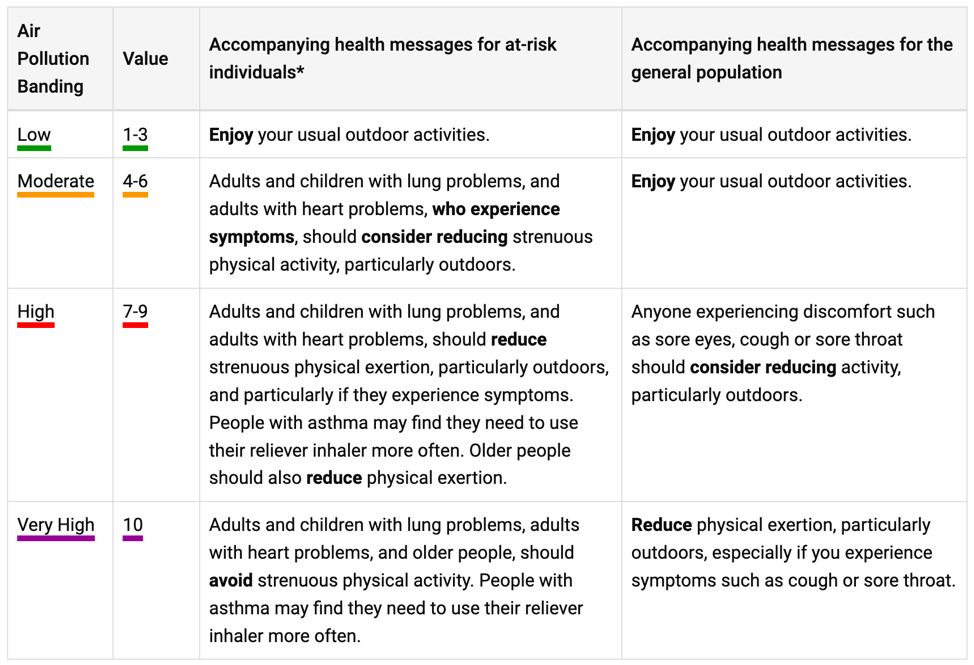
Fig 1: Defra’s DAQI recommended actions and health advice
Using the measurements to create an AQI
Measurements for each pollutant are given as an average and there are different averaging periods depending on the pollutant. For example, O3 is taken as an eight-hour average, while PM2.5 in the air is given as a 24-hour average.
The overall index number given for a particular period is whichever pollutant comes in at the highest level for that day.
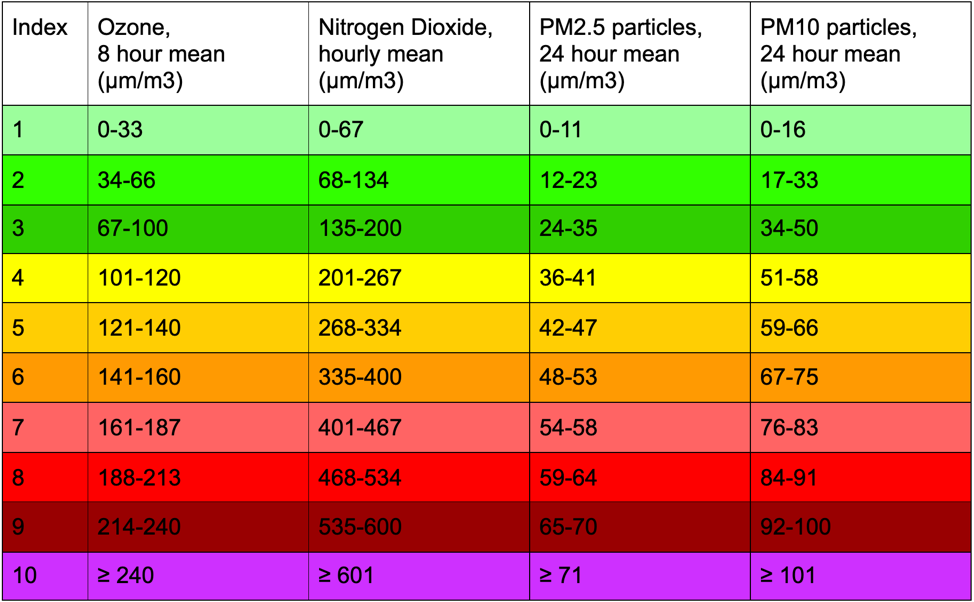
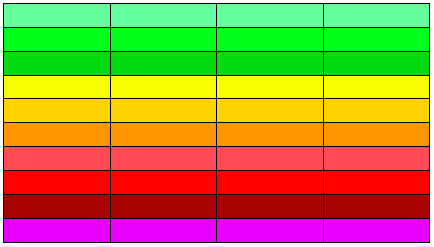
Fig 3: Defra’s AQI table
For example, let’s imagine that on a particular day, we record the following measurements:
- O3 – 8 hour average (mean): 68 (Level 3)
- NO2 – hourly mean: 137 (Level 3)
- PM2.5 24 hour mean: 37 (Level 4)
- PM10 24 hour mean: 35 (Level 2)
In this example, we see that O3 and NO2 are placed in level 3, PM2.5 is level 4 and PM10 is level 2. Therefore, because the overall index for that period is whichever returned the highest reading, the AQI reading for the day would be a level 4.
Using Defra’s air pollution banding (see fig 2 above), levels 1-3 are in the Low band, whereas 4-6 are in the Moderate band. So on this particular day, we would consider the AQI to be level 4 and the pollution level to be Moderate – which you’ll see comes with a health warning for certain people.
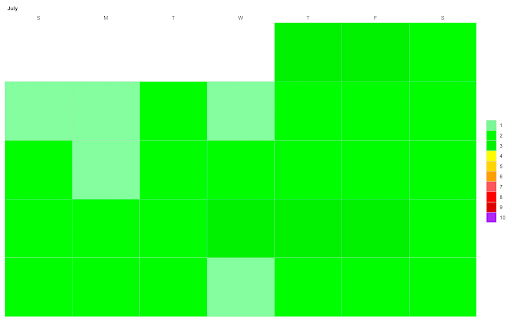
For our own index, we used this methodology to create an overview of air quality recorded each month. The example below is taken from our July data bulletin and it shows our AQI for Darley Avenue. We have used the same air-pollution banding and colouring as Defra.
Other things to consider
As outlined earlier, our index differs from that used by Defra because our air-quality monitors don’t capture exactly the same pollutants – and – they also have a UK-wide network from which they can draw on a much larger dataset.
So, the measurements from our air-quality monitors should be considered as an indication of what is going on, illustrating some short-term effects at a very localised level. We can pick up events such as pollutants from cars idling nearby or from residential heating, but this is not representative of the Chorlton or Chorlton Park wards.
It’s also worth remembering that when measuring air quality, many factors come into play, such as temperature, weather and other environmental conditions.
Sources and resources
You can download all of the Our Streets Chorlton data, including both air quality and traffic, here. If you have questions or thoughts about anything explored here, please contact us.
Other sources:
https://uk-air.defra.gov.uk/air-pollution/daqi
https://www.aeroqual.com/meet-the-nitrogen-oxide-family
https://www.explainthatstuff.com/air-pollution-introduction.html
About Our Streets Chorlton
Our Streets Chorlton is a partnership between WalkRideGM, Groundwork Greater Manchester, Sustrans and Open Data Manchester, funded by the National Lottery Community Fund. It aims to help create a healthier, cleaner and greener Chorlton by enabling more people to get around enjoyably, and safely, on foot, wheelchair and bike.
Find out more about Our Streets Chorlton and sign up for project news.