In July 2020, we were delighted to be part of a team that was awarded ODI Stimulus Fund money to develop an open data standard for public information about local recycling facilities. This has since developed into the Innovate UK-backed Plastics Packaging Portal, which will combine two waste standards. Dsposal is still collaborating with us on this work, and here data research intern Jamie Dumayne and CIO Tom Passmore explain how and why they’ve been visualising Household Waste Recycling Centres in Wales.
—
At Dsposal, we want to understand the drivers and blockers of residents and businesses reducing, reusing or recycling their waste.
We know that data visualisations can help turn dry numbers into more insightful and compelling information that can be easily understood, and, using ‘drive-time analysis’, we can show how long it takes to drive to a specific point.
So, we decided to look at the drive time to Household Waste Recycling Centres (HWRCs) in Wales.
Why Wales?
Out of the UK’s four nations, Wales has the fewest HWRCs – at 77 – while Northern Ireland has around 90, Scotland about 170 and England in the region of 650.
Working on the smallest set of data first meant that every step of the process could be checked, and double checked, more easily and quickly. Then, once the process had been tweaked and honed, we could move onto other nations.
Mapping drive times in Wales
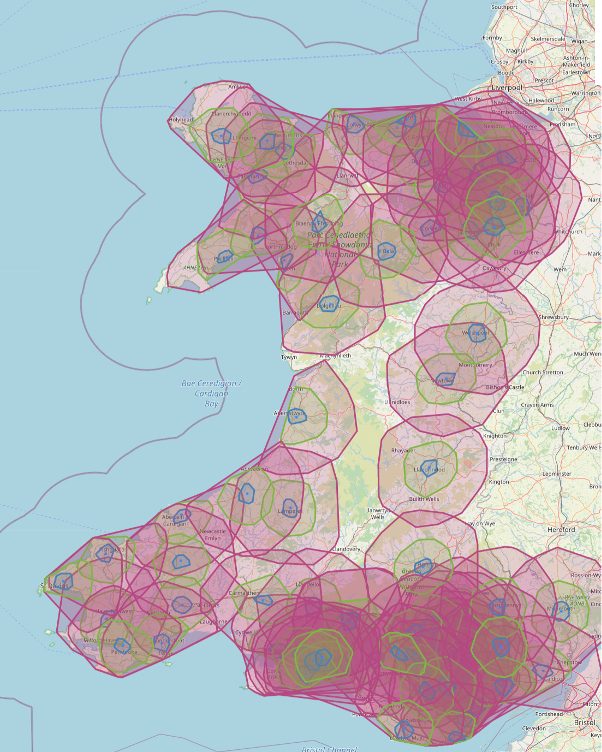
We started by making a map of all the HWRCs in Wales and the areas surrounding them that are within a certain drive time. Each HWRC is mapped and surrounded by different coloured shapes – blue represents areas within a five-minute drive, green shows the areas within a 15-minute drive and pink is a 30-minute drive.
As you can see below, the major population areas of the north and south of the country are covered by many recycling centres, while the middle has very few. This map is a good proof of concept, however there were several improvements that could be made.
What about Llandovery?
Data visualisations help us ask questions of data that aren’t obvious when it is in cells of a spreadsheet or a list on a page. One question that we had when looking at the map was “did we miss a centre around Llandovery and Llanwrtyd Wells?”.
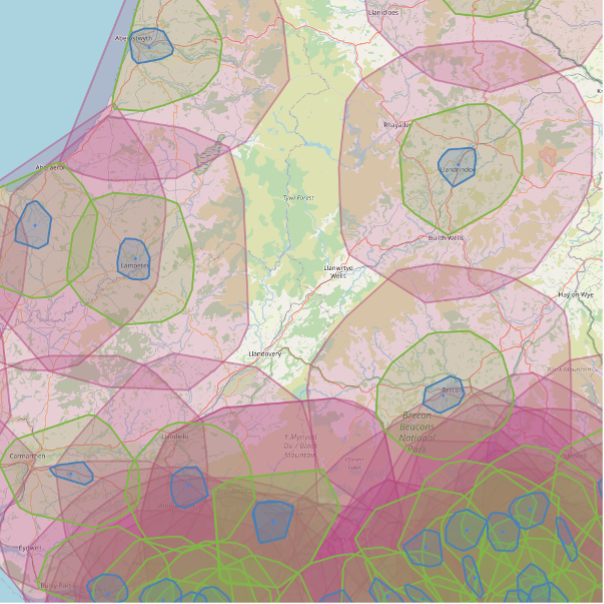
Llandovery is a market town and community in Carmarthenshire, towards the south-west of Wales.
The waste disposal authority is Carmarthenshire County Council, which operates four centres, and the closest one to Llandovery appeared to be Wernddu Recycling Centre in Ammanford.
Through this exercise, we realised that we hadn’t missed plotting a centre Llandovery, the area was just outside the furthest drive time of all four local recycling sites.
This then prompted another question – “how do people in Llandovery get rid of their waste?”.
And the answer… is that Llandovery has ‘Waste Amnesties’ where “most household waste can be taken along to a waste and tyre amnesty – including unwanted furniture, carpets, mattresses, electrical items such as fridge-freezers and televisions. Garden waste accepted.”
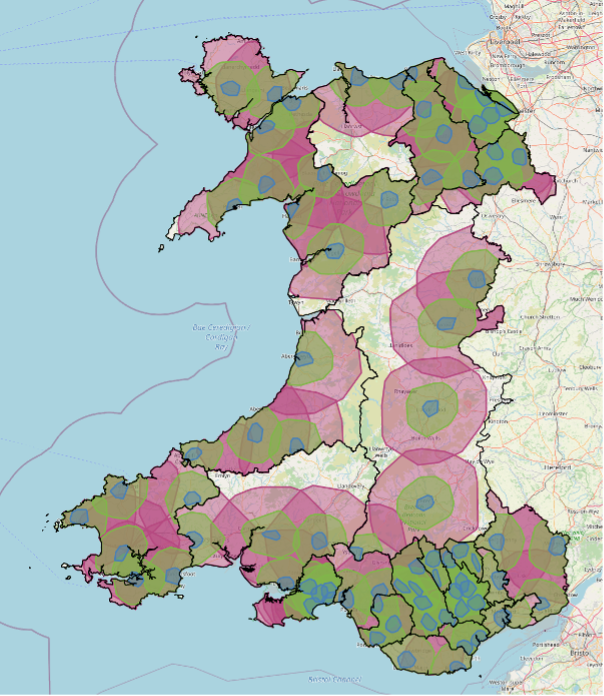
A note about disposal authority borders
Showing the drive time to different sites without limits hides an important truth about recycling centres – not all nearby residents can use all HWRCs. Generally, people can only visit a HWRC in the disposal authority region that they live in.
In future iterations, it will be interesting to explore the map that includes English HWRCs, to understand how the English-Welsh border impacts residents’ closest HWRC.
Assumptions and improvements
The drive-time distance is calculated by assuming that a person is driving at a constant speed of 30 mph. This is acceptable for a first map, but needs to be improved on in future iterations.
This could either be done by calculating an approximate average speed for each of the drive times – for example – someone driving for half an hour would on average drive faster than 30 mph. The other option would be to access an API to calculate the average speed, however, this would significantly increase the time taken and cost of producing the map.
Another improvement to the map is in the areas where lots of recycling centres overlap. Around Cardiff and Swansea, the driving distances could be clearer, as there are currently many different shades of green and pink. The best ways to improve this will be explored for the next iteration.
Additional features and further questions
Making the visualisations is interesting and prompts some good questions that need to be asked – but how do we take this further? How do we make the map functional so that users can interact with it?
Additional features we have already talked about are:
- Turn different colours off to only show 15-minute journey times (for example)
- Include waste-site services so that you can see the drive-time analysis for HWRCs that accept specific items – like those that take asbestos, or allow trade vehicles
What other analysis could we do alongside the drive time? It would be good to show how recycling centres compare with population distribution:
- Are there any extra areas of the map that have enough people to warrant a new recycling centre?
- Are there any places where there are too many recycling centres for the population?
Acknowledgments and next steps
This would not be possible without open data, open-source technologies, and the communities that support and grow these resources. These include, but are not limited, to:
- Leaflet – an open-source JavaScript library for mobile-friendly interactive maps
- Open Street Map – built by a community of mappers that contribute and maintain data about roads, trails, cafés, railway stations and much more, all over the world
- Code The City – a civic-hacking initiative interested in using tech and data for civic good – through hack weekends, open data, workshops and idea-generation tools
- Python – an open-source programming language
Once the final maps of all the HWRCs and corresponding disposal authorities has been created, this will be released into the open on a CC0 licence, meaning that there are no rights reserved on it, no attribution has to be given, and it can be used for both commercial and non-commercial purposes.
Here’s the second blog in this four-part series – which explains how we took what we learned to make their first map better.