In July 2020, we were delighted to be part of a team that was awarded ODI Stimulus Fund money to develop an open data standard for public information about local recycling facilities. This has since developed into the Innovate UK-backed Plastics Packaging Portal, which will combine two waste standards. Dsposal is still collaborating with us on this work, and here data research intern Jamie Dumayne and CIO Tom Passmore explain how their work on visualising Household Waste Recycling Centres has developed.
––
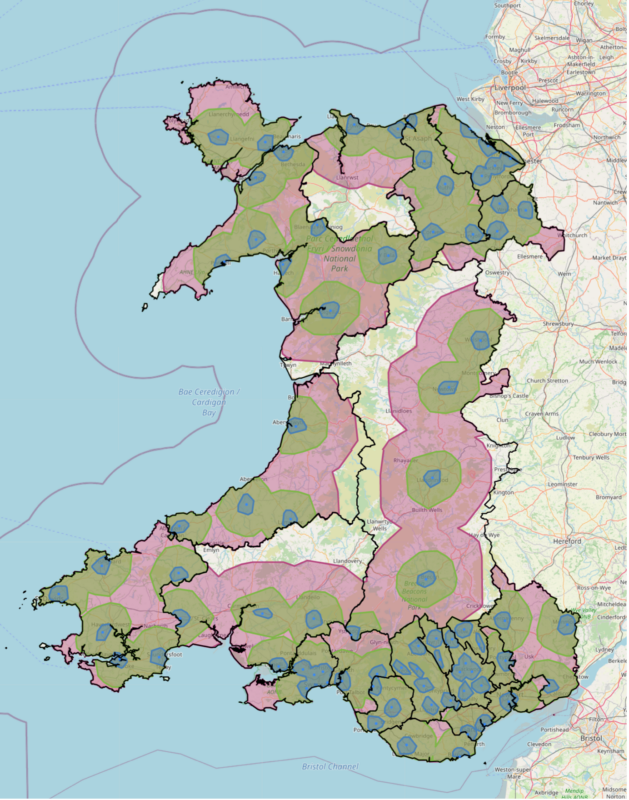
In our last blog, we showed how we made a map of Household Waste Recycling Centres (HWRCs) in Wales – but we knew there was room for improvement.
Around each HWRC, there was a different coloured polygon representing how long it would take to drive there from somewhere nearby. Pink represented a 30-minute drive, green represented a 15-minute drive, and blue represented a five-minute drive.
However, the previous version of the map made the assumption that everyone within these driving distances was allowed to go to that HWRC.
In reality, the UK is broken up into local-authority districts and it is within these areas that a waste authority is responsible for collecting waste.
For example, Cardiff Council is responsible for waste in the city and county of Cardiff. This means, when the driving distances are calculated, they need to be limited to the waste authority’s borders here.
To restrict the driving distance, additional steps need to be carried out:
- The waste authority’s borders are imported from a GeoJson file.
- The location of a HWRC is taken from a CSV file, which also contains the name of the waste authority that the HWRC sits within.
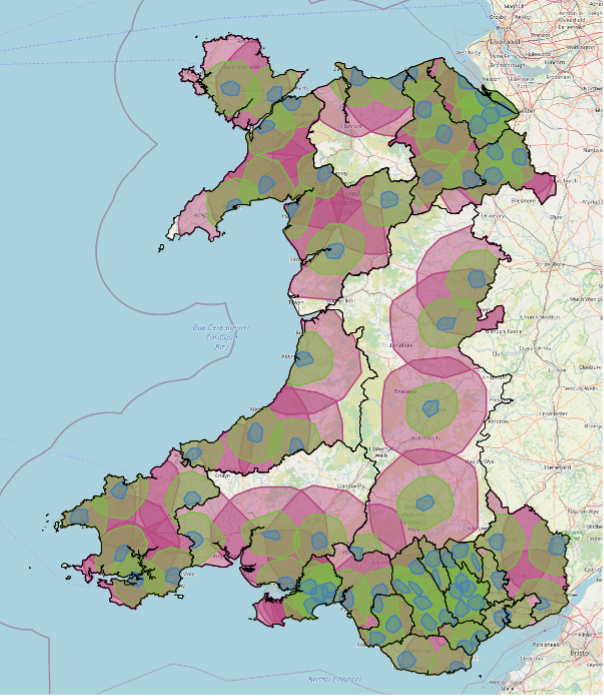
- Then we take the driving-distance polygon and the waste-authority borders, and find the overlap between them. This process works in the same way that a cookie cutter cuts out a shape in cookie dough. If the driving distance is the cookie dough and the waste-authority border is the cookie cutter, we only want the dough that’s within the cookie cutter. This process ensures that the polygon fits perfectly to the waste-authority area.
Tidying up the map

Now that the driving-distance polygons reflect the true areas that the HRWCs serve, it’s onto the next issue – with the polygons overlapping each other (especially around Cardiff), it can be difficult to read the locations on the map underneath.
To overcome this, the polygons for the same driving distance have been merged into one shape. This also had the added benefit of reducing the file size of the map.
For this, an initial polygon for a driving distance was identified, then a second one merged with it, giving the outline of both. Then more polygons were added until all of the polygons had been merged into one complex polygon for each driving distance.
The good news is that the open-source programming language Python, used for this task, is clever enough to carry out this operation and, if two polygons didn’t overlap when being merged, it would automatically save them as a multi-polygon instead.
What’s next?
Now that the map of Wales is of suitable quality, it is time to move onto the other three countries in the UK, so similar maps of England, Northern Ireland and Scotland will be made. One issue we may run into is keeping the file size of the map down.
The map is exported from Python as a html file, but the waste-authority borders used are extremely high resolution. This led to an increase in the file size of the maps and the driving-distance polygons being more high-resolution than necessary. The file size of the map of Wales is now approximately 150mb, which causes it to open slowly.
Scotland has approximately double the number of HWRCs that Wales does, while England has approximately 10-times the number of HWRCs of Wales – so file size could be a major issue to tackle going forward.
Here’s the third blog in this four-part series, which talks about how we applied what we learned to the rest of the UK.