In July 2020, we were delighted to be part of a team that was awarded ODI Stimulus Fund money to develop an open data standard for public information about recycling in the UK. This has since developed into the Innovate UK-backed Plastics Packaging Portal, which will combine two waste standards. Dsposal is still collaborating with us on this work, and here data research intern Jamie Dumayne and CIO Tom Passmore explain how their work on visualising Household Waste Recycling Centres has developed.
–––
After getting a map of Wales’ Household Waste Recycling Centres (HWRCs) to a suitable level of quality, detailed in our last blog, it was time to move on to making maps of recycling sites in England, Northern Ireland and Scotland.
We used the same process for creating these maps as discussed in our last two posts – so each map shows the driving distance to every HWRC – where the blue polygons represent a five-minute drive, green is 15-minutes and pink shows a 30-minute drive.
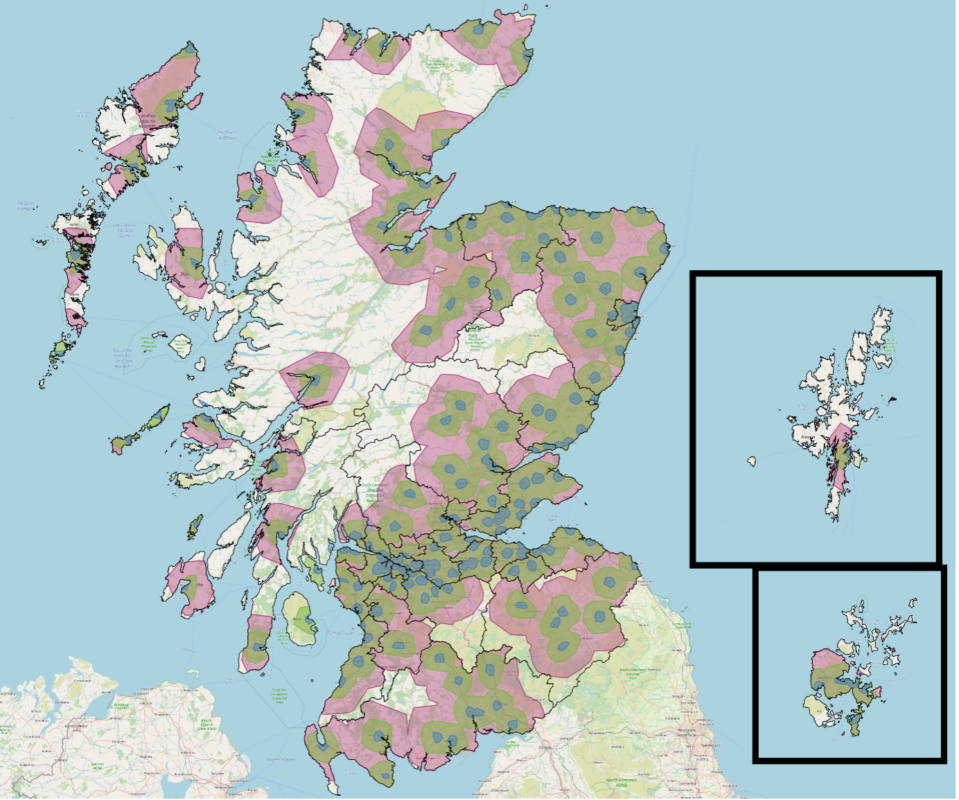
Scotland

The maps of Scotland and Wales are very similar, where rural areas have relatively poor local recycling services, while urban areas are mostly never more than 15 minutes from a HWRC. On the Scottish map, you can clearly see the ‘central belt’ of Scotland, where most people live, just looking at the locations of HWRCs.
Northern Ireland
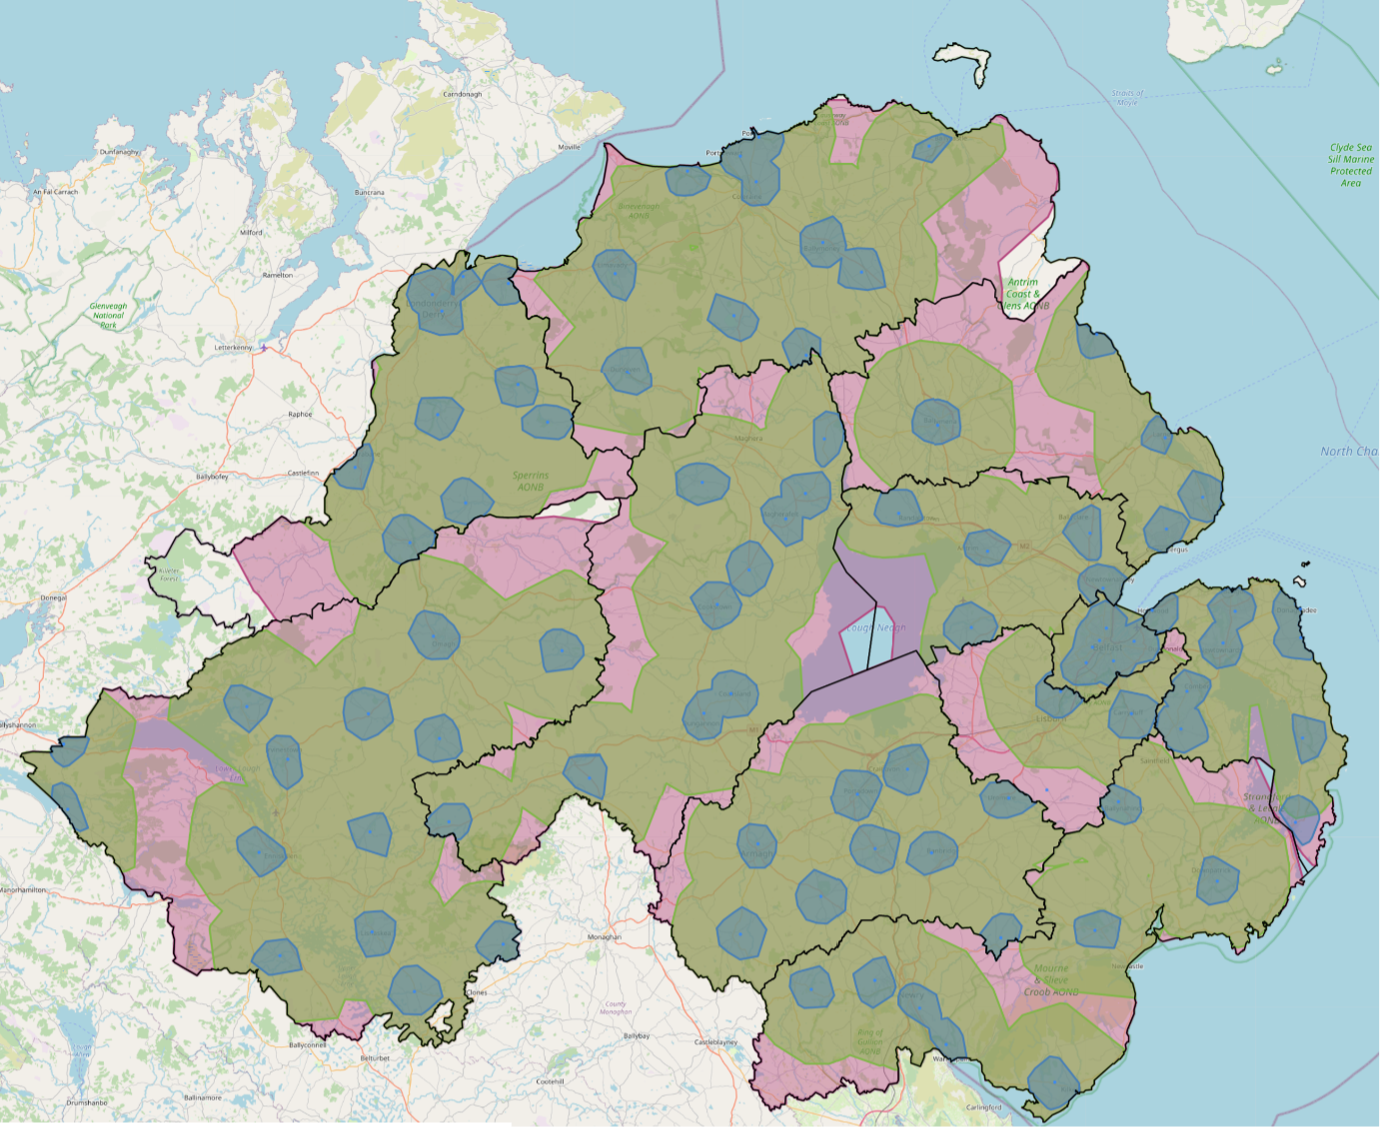
Compared with the previous two nations, Northern Ireland seems to have much higher coverage of HWRCs. This trend will be interesting to look at again when the maps contain population density data too.
England
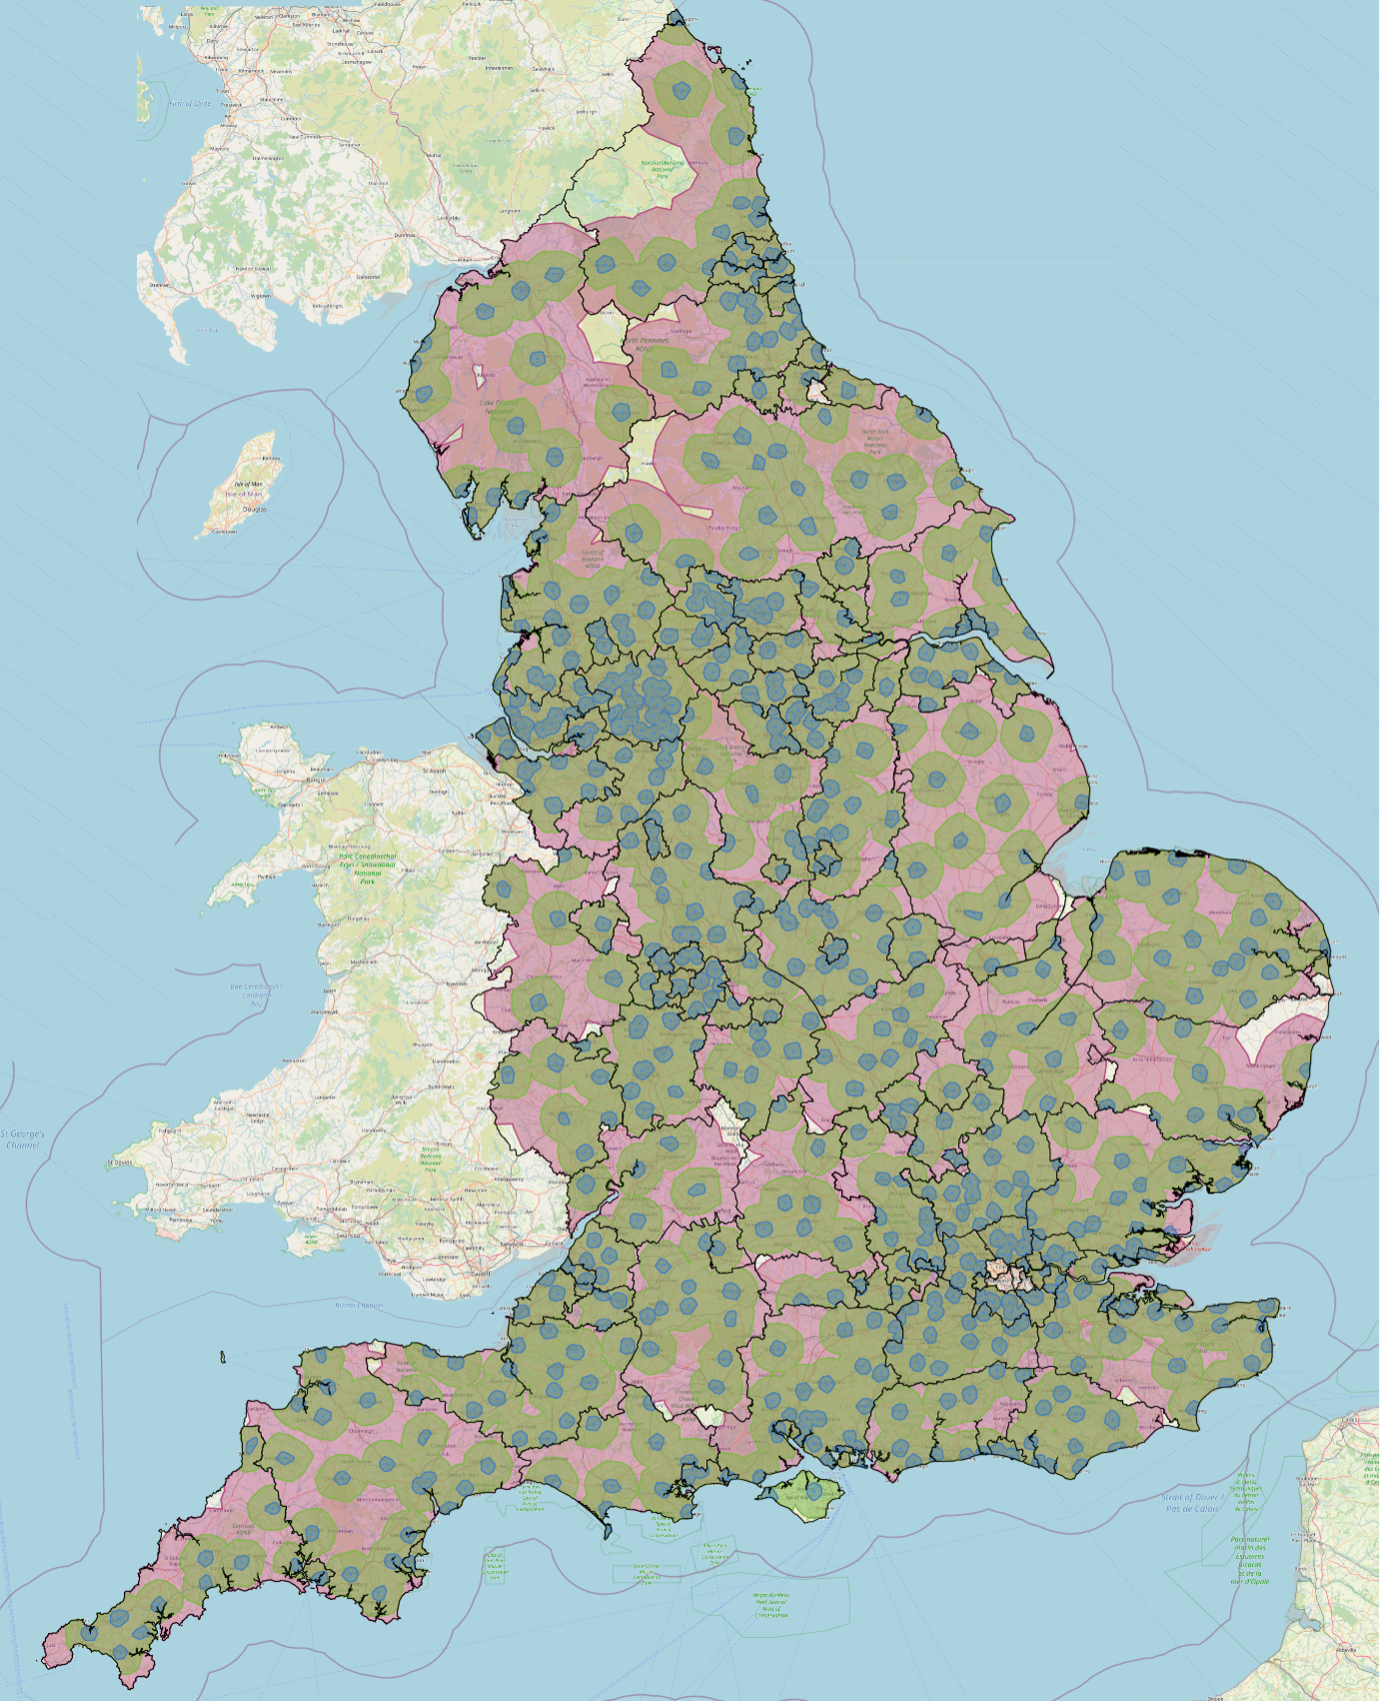
Creating the map of England was a significant undertaking – it took around a week to collect all of the data. That’s because England has 664 HWRCs, the code takes 12 minutes to calculate the three driving distances for each HWRC, so that adds up to 5.53 days of continuous computing time.
We also ran into an issue with England’s HWRCs because some waste authorities here appear as separate entities, but in reality they’ve been merged into one larger waste authority. This was a problem in London, Manchester and Merseyside. The issue was fixed by getting the correct waste-authority borders.
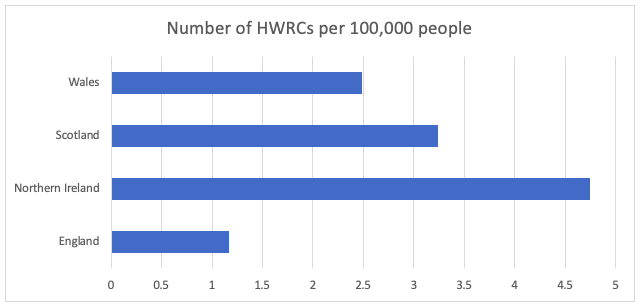
Comparison of recycling in the UK
We’ve seen how HWRC coverage differs between the four countries on a map, but we wanted to see how the actual figures compared for recycling in the UK. On the maps, it looks like England and Northern Ireland have significantly better coverage than Wales and Scotland. But is this true?
Unfortunately, we don’t have population density data yet, so we had to take a different approach to answering this question. A quick litmus test would be to see the number of HWRCs per 100,000 people in each nation.
To do this, we sourced population data from the Office for National Statistics’ mid-2020 population estimates survey[1].
Changing the map-making process
A change we made behind-the-scenes made making these maps significantly easier. For the Wales map, the driving-distance polygons were calculated and added to the map within the same script. This would take approximately six hours. It would then take nine hours to make the map of Northern Ireland.
But as mentioned previously, England and Scotland have significantly more HWRCs, meaning this style of working would not be possible.
So instead, a selection of HWRCs would have their driving distances calculated, then saved, then repeated for the next selection of HWRCs until all of them were complete. The saved driving-distance polygons were then imported into a different script and plotted onto the map.
This meant the computer did not have to be left running around the clock. It also meant that if something went wrong with the code, then only a small chunk of data would have to be recalculated, rather than the entire map.
What’s next for recycling in the UK?
When expanding a process to include more data, there are always problems. When making the maps of England and Scotland, there were some HWRCs that didn’t produce driving-distance polygons. This wasn’t spotted until we had made the full map.
An example of this is the Isle of Arran, where the five-minute and 15-minute driving distances were calculated, but the 30-minute polygon wasn’t. We will need to go through these locations to find out why they didn’t work and fix them.
The next step for the maps would be to add in data from other sources to give us an even better understanding of recycling in the UK. The main place we want to start is to add population data to the map, so we can see how the driving distance from a HWRC compares with where the population is located.
Here’s the final blog in this four-part series, which talks about how we added population estimates to our maps.
Reference
[1] https://www.ons.gov.uk/peoplepopulationandcommunity/populationandmigration/populationestimates/bulletins/annualmidyearpopulationestimates/mid2020