
As part of Our Streets Chorlton, Open Data Manchester has installed a number of Telraam traffic counters in different locations around Chorlton and Chorlton Park.
Telraams contain small cameras that are connected to a Raspberry Pi microcomputer, and they are able to count cars, heavy vehicles such as lorries, bikes and pedestrians.
Since around March 2021, a number of local residents have had them installed in their window so they can record the level of traffic on their street.
With the new school year kicking off this month, and full crowds allowed to attend football matches again, we decided to take a dive into what the data could tell us about how these things affect traffic levels around Chorlton.
To do this, we chose to look at four locations:
Kensington Road, Oswald Road and Egerton Road North are regularly used by people to travel in and out of Chorlton, so we expected to see them affected when there are Manchester United football games being played.
We expected Kensington Road to be particularly affected, as this road leads towards Trafford and the Old Trafford stadium. Oswald Road intersects with Kensington Road, so we also expected to see some relationship between these two.
Local residents believe that Egerton Road North and Oswald Road are often used to avoid the traffic lights at the Wilbraham Road and Barlow Moor Road junction (known locally as ‘Four Banks’), so we would also expect to see some impact here.
Both Darley Avenue and Oswald Road have primary schools on them, so we expected there to be some increase in activity during the school run, but perhaps less of an impact on Darley Avenue during football matches.
What impact does Manchester United football traffic have on Chorlton?
What we did
Manchester United played two home games during this time – on Saturday 7 August 2021 and Saturday 14 August 2021 – in which full crowds were allowed to attend.
So we downloaded the Telraam data for all Saturdays in August and took an average of all the Saturdays where there was no home game in order to get our baseline.
We then compared this average to the days where there was a home football game being played, where we would expect to see the impact of Manchester United football traffic.
No game played versus match days
The graphs below show the average number of cars recorded at our chosen location on Saturdays throughout August compared with the two days that Manchester United played a home game with full crowds in attendance.
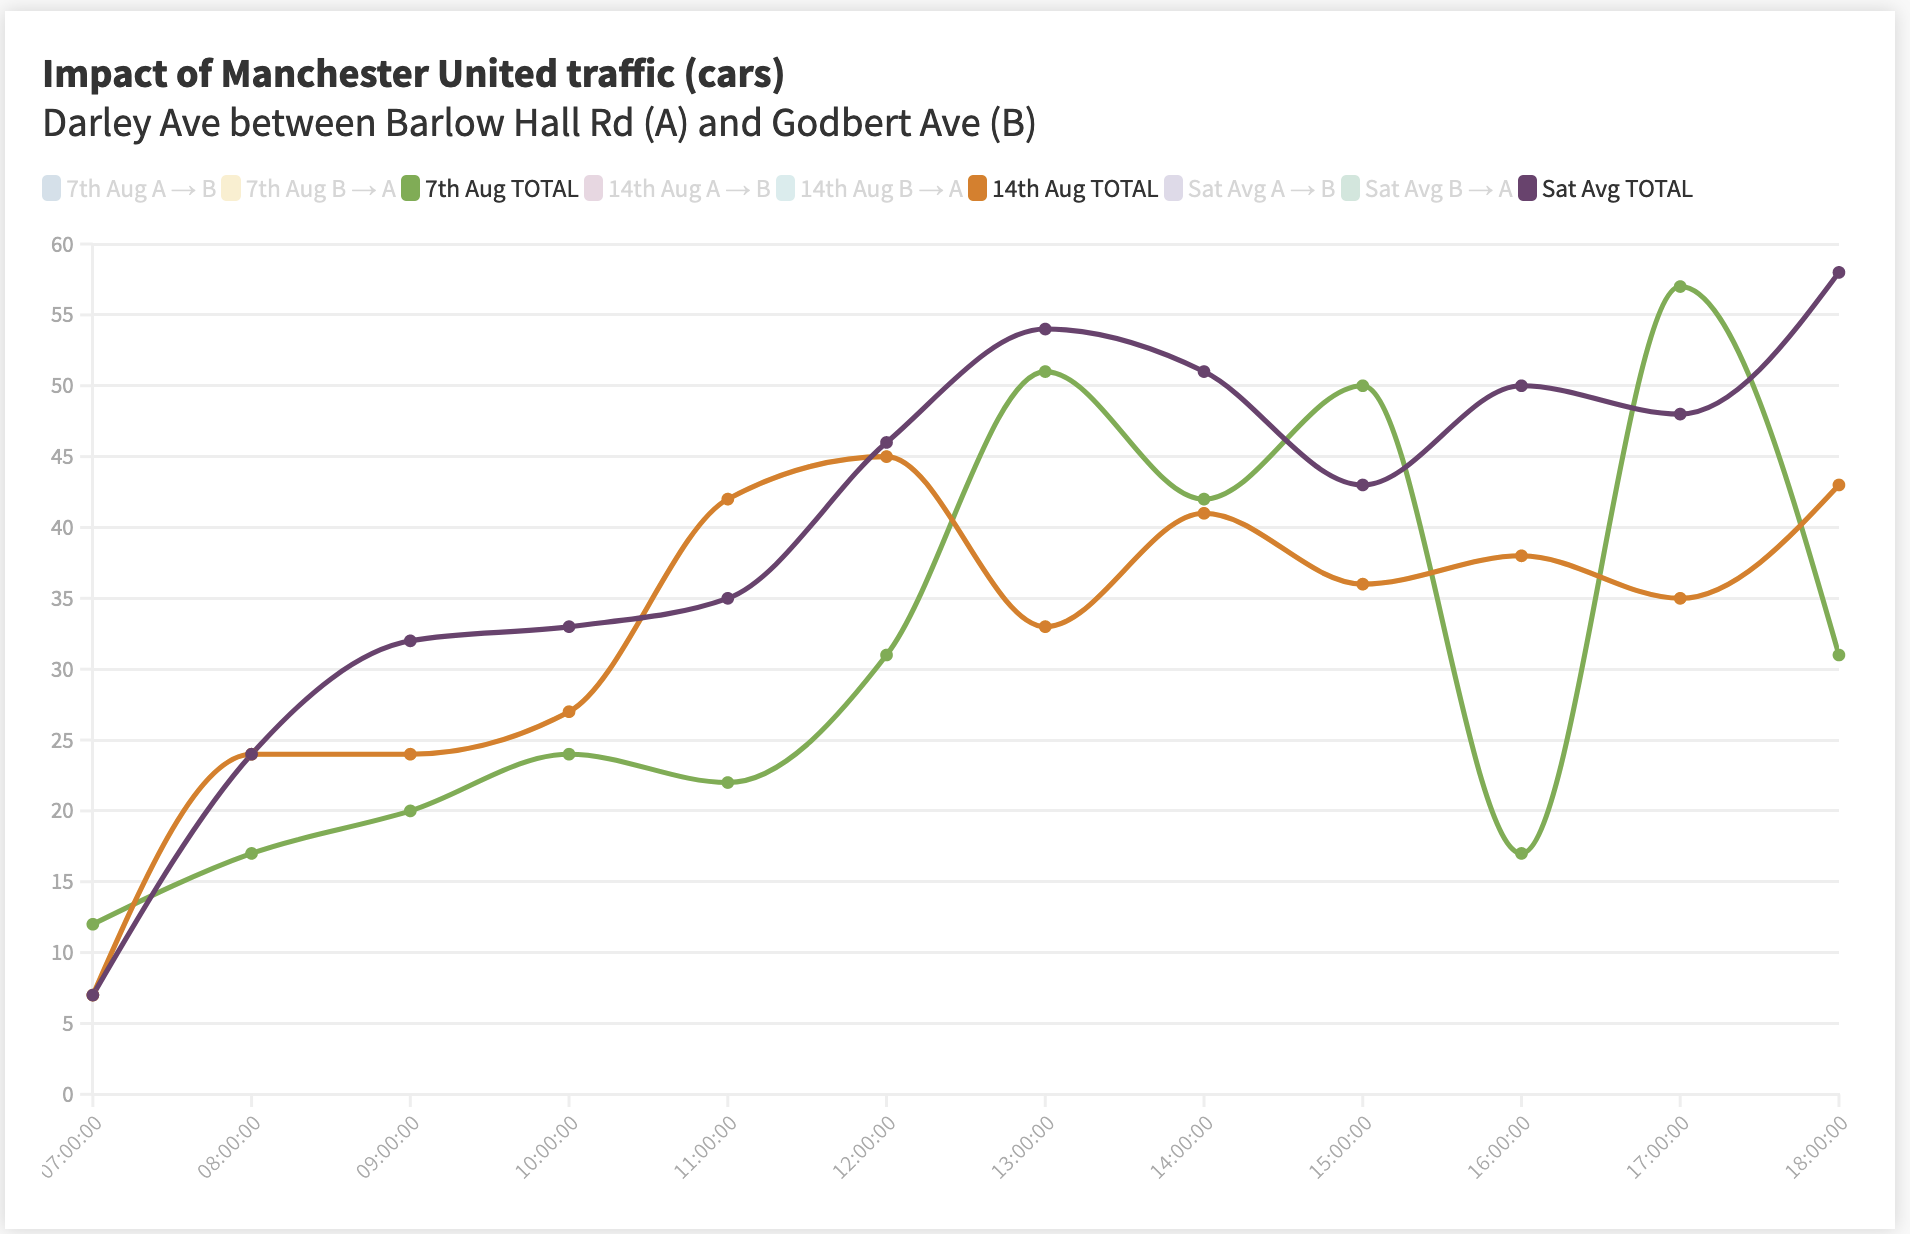
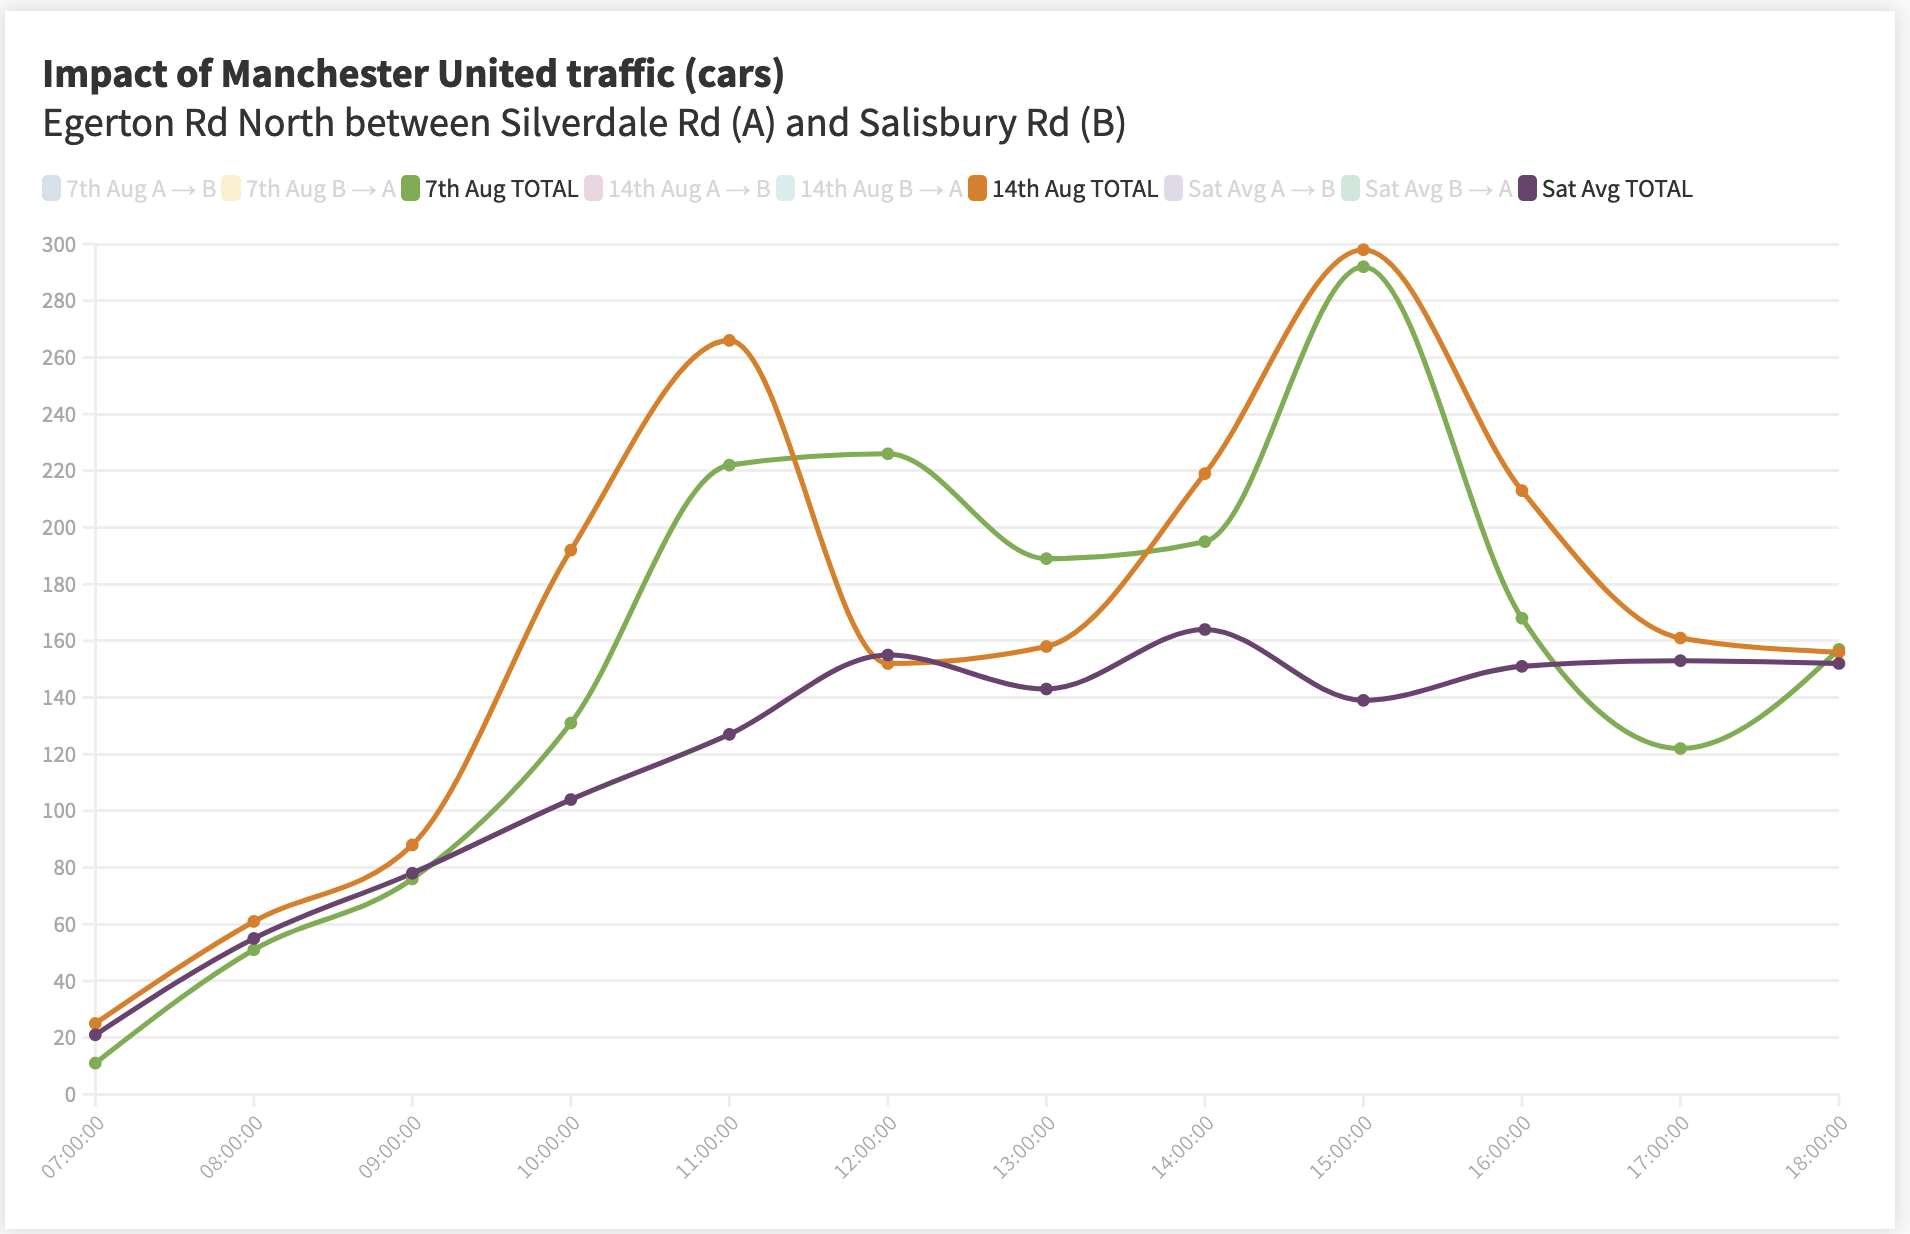
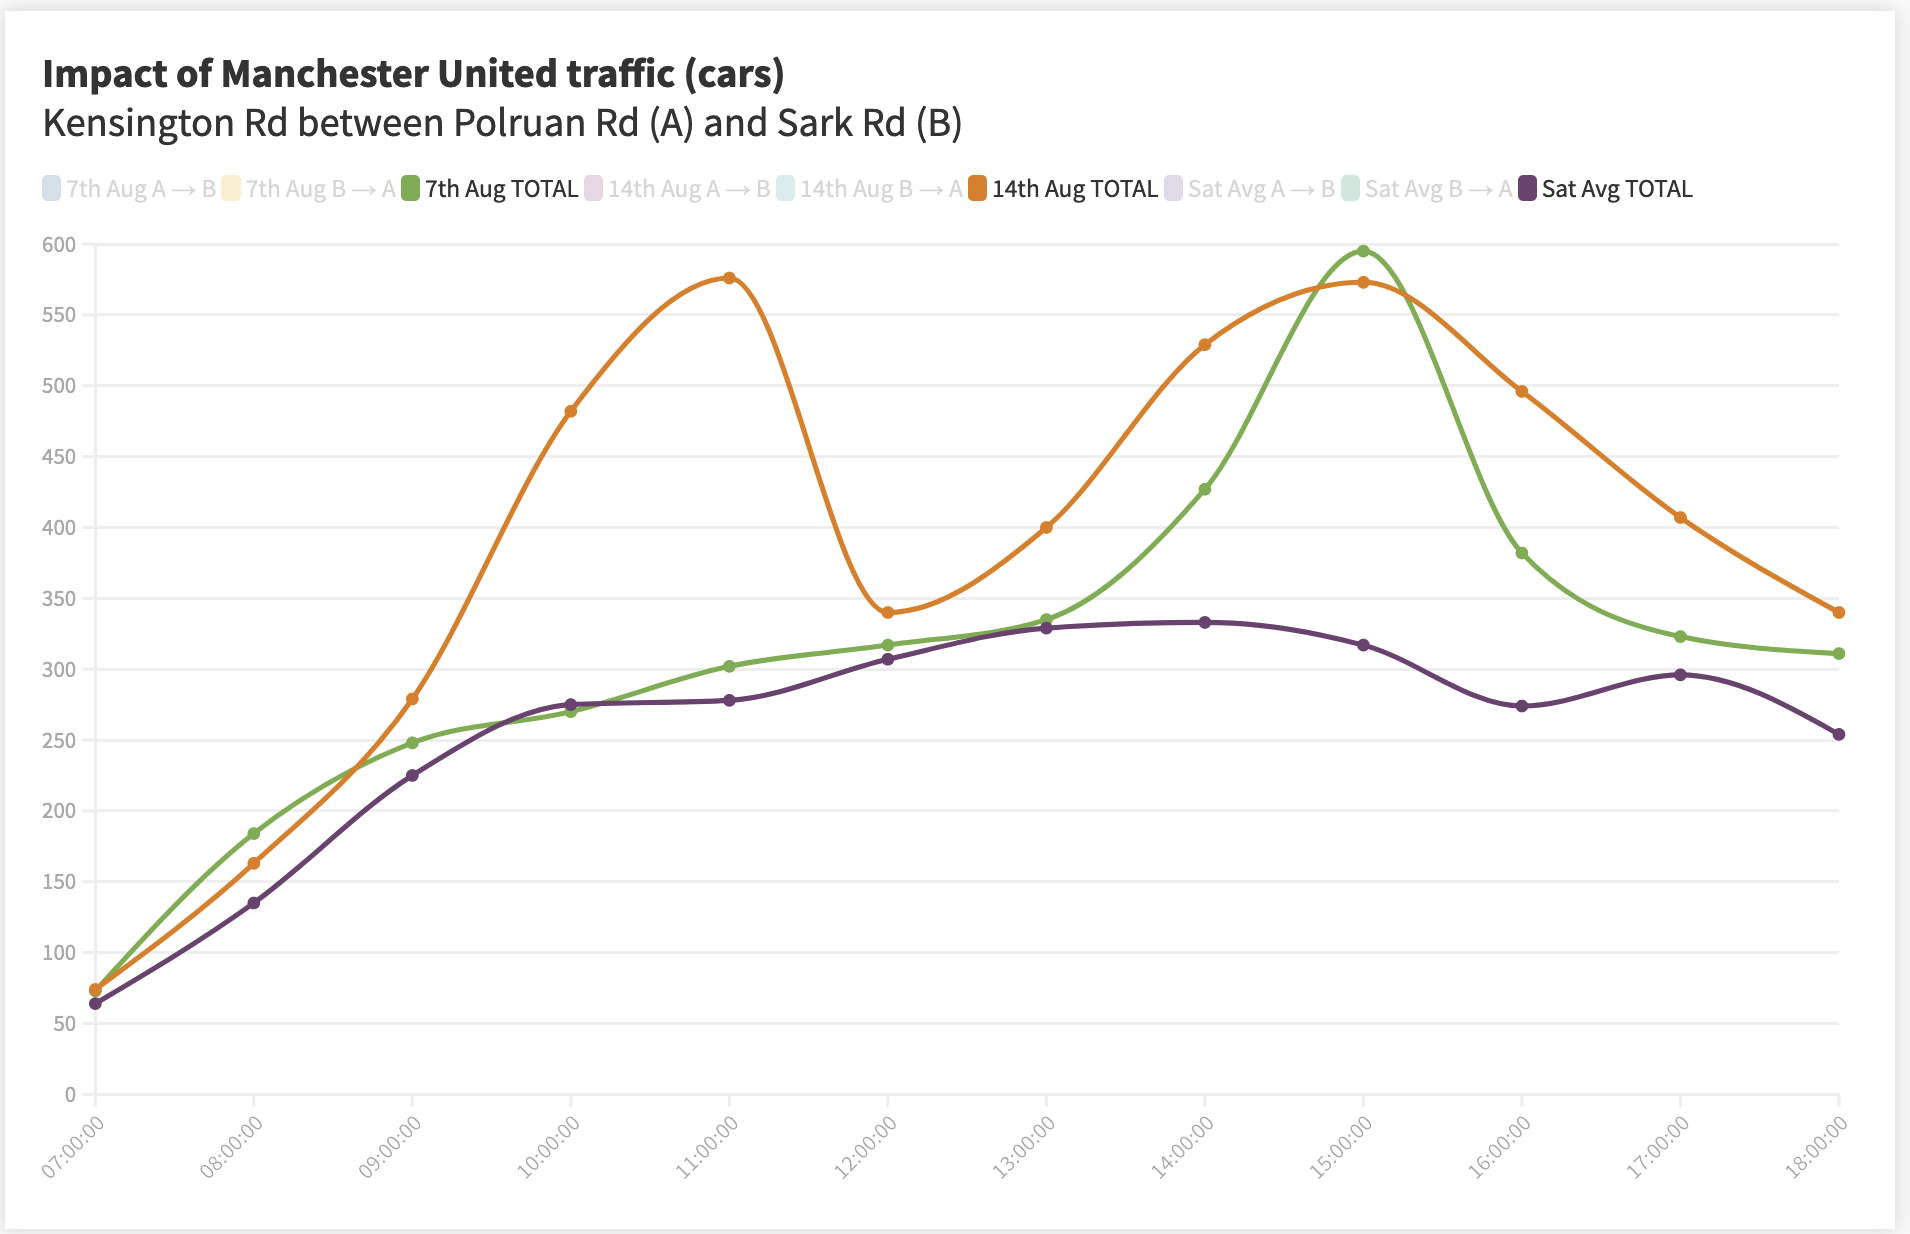
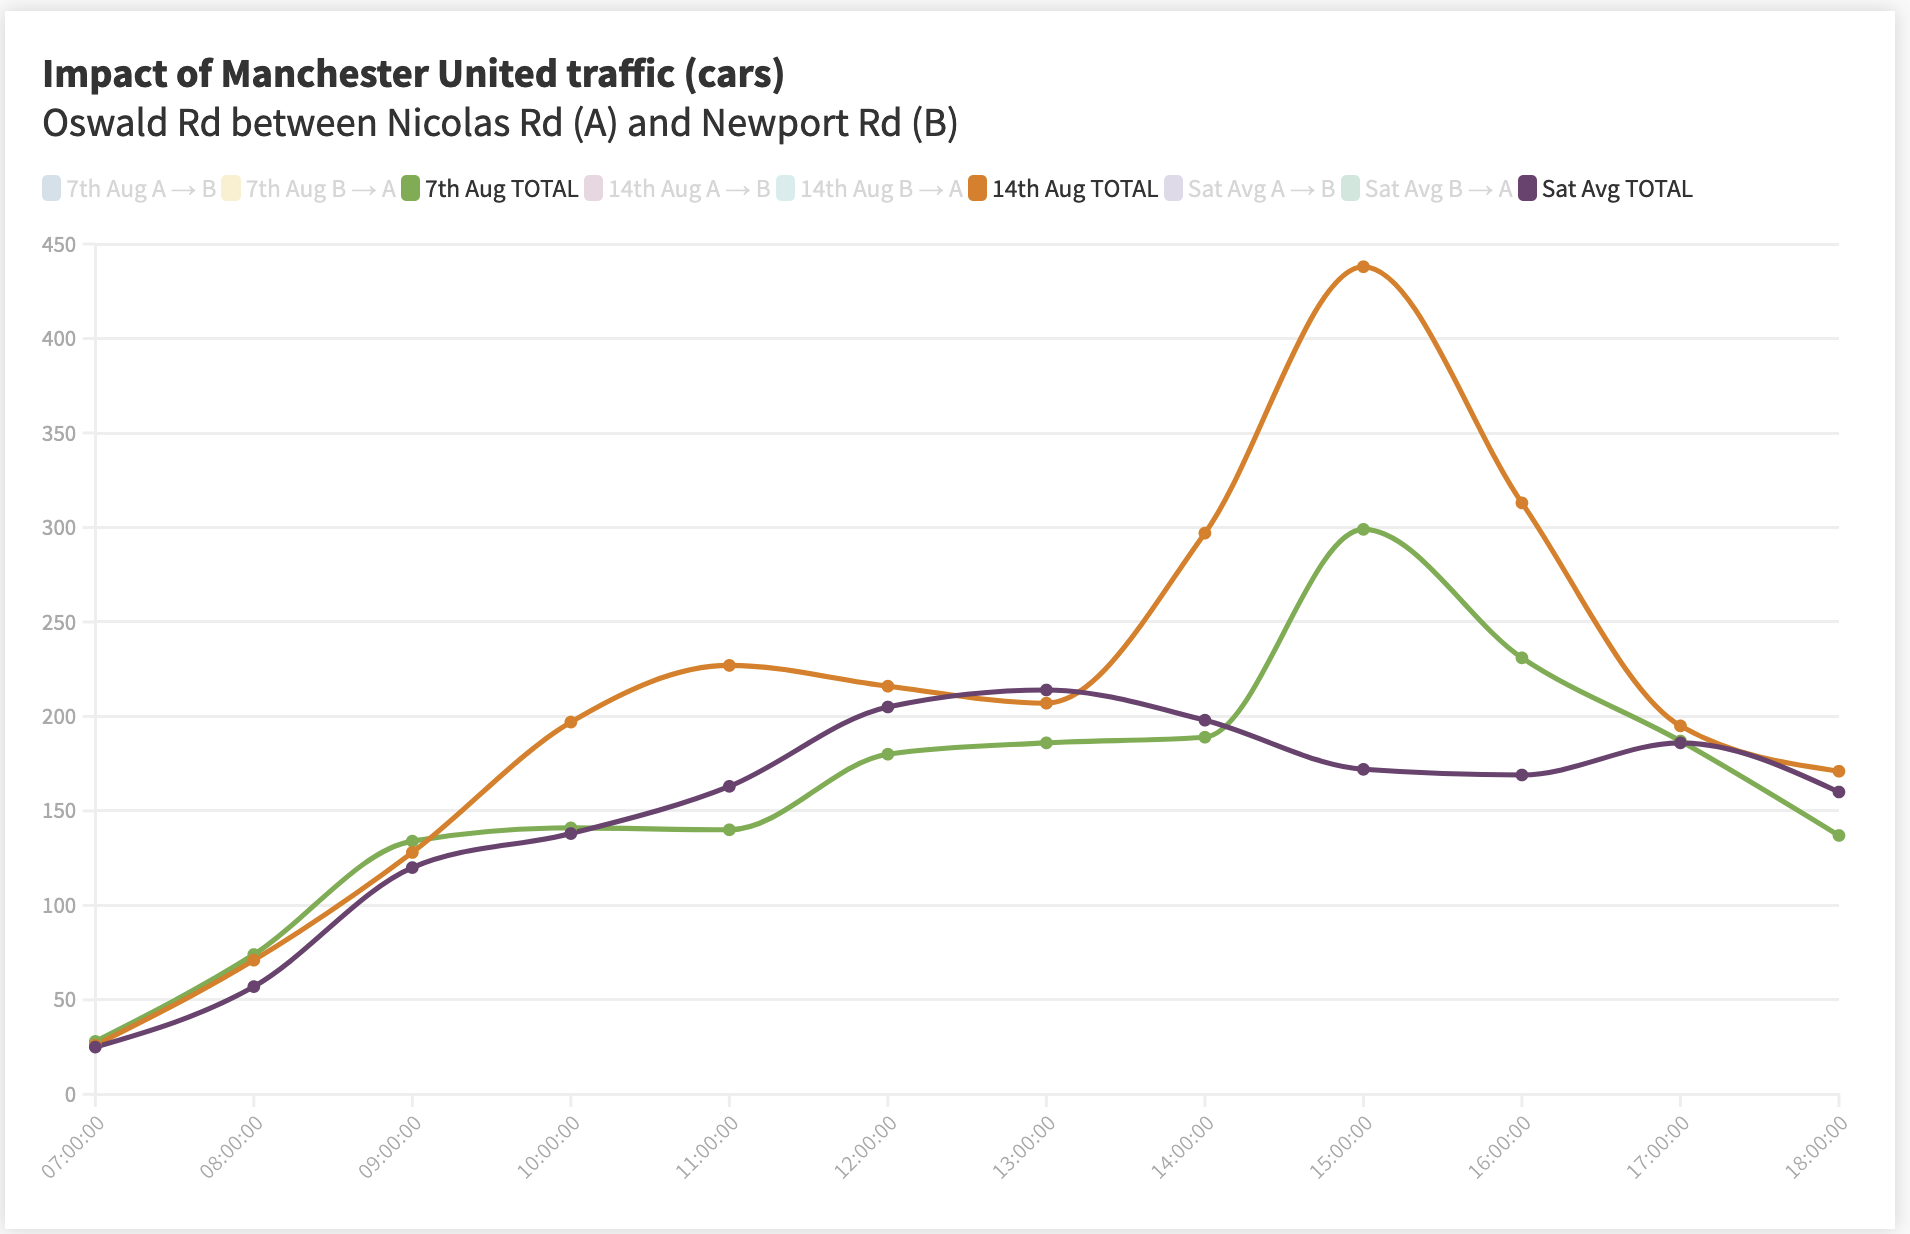
On Kensington Road, Oswald Road and Egerton Road North, we can see peaks in traffic on 7 and 14 August that are not present on the average of days where no football game is played. On 14 August, we see peaks at 11am and 3pm, which would be consistent with a midday kick off and end of play. Interestingly, we do not see this early 11am peak on Oswald Road.
For the game on 7 August, we see a 3pm peak, which again corresponds to the game’s kick-off time, and so could represent Manchester United football traffic on Darley Avenue. However, we do not see a later peak after the game.
On Darley Avenue, which is located further south of the other locations, and is not considered to be a through road towards Old Trafford stadium, we do not see the same peaks in traffic. Interestingly, on 7 August, we actually see a marked dip in traffic at 4pm. This could be due to something like a temporary road closure.
Comparing all locations
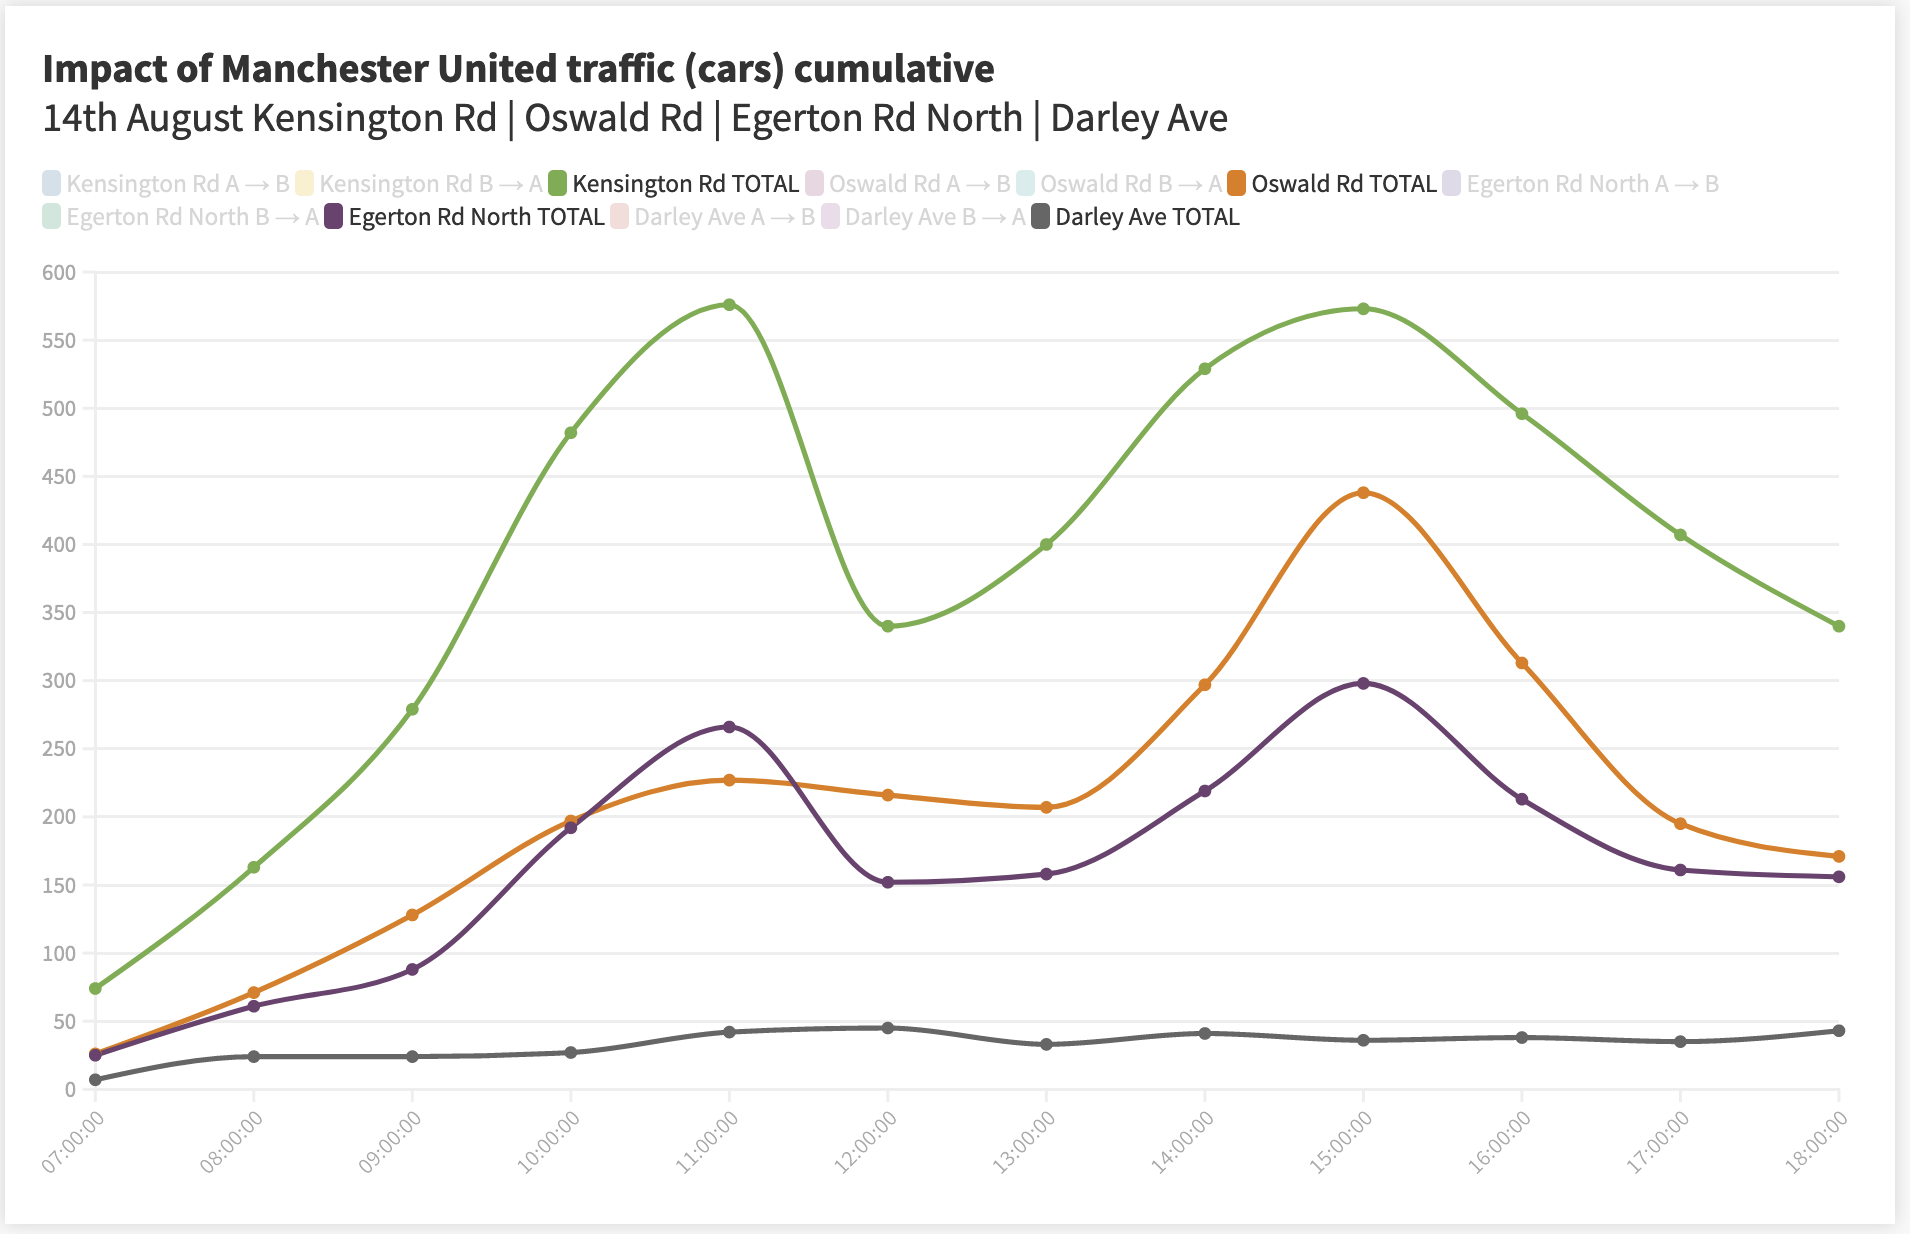
The graph above shows car traffic at all four locations on 14 August 2021. Again, we see the peaks in traffic at around 11am and 3pm, which corresponds with the midday kick-off time.
For comparison, we can also see that the same peaks do not appear in the Darley Avenue data. This matches our expectation that Darley Avenue would not be as affected by Manchester United football traffic as the other three roads.
What impact does the new school year have on traffic around Chorlton?
What we did
Firstly, we wanted to see whether the school run has an effect on the traffic at our four locations. So, we downloaded data from our Telraam units for all Tuesdays in August, when schools were closed for the summer holiday. Then we took an average of these Tuesdays to create our baseline.
We then downloaded the data for the first Tuesday that schools were open, which was on 7 September 2021. We then compared this with our August baseline to get an indication of how the school run affects traffic at our four locations.
Summer holidays versus the start of term
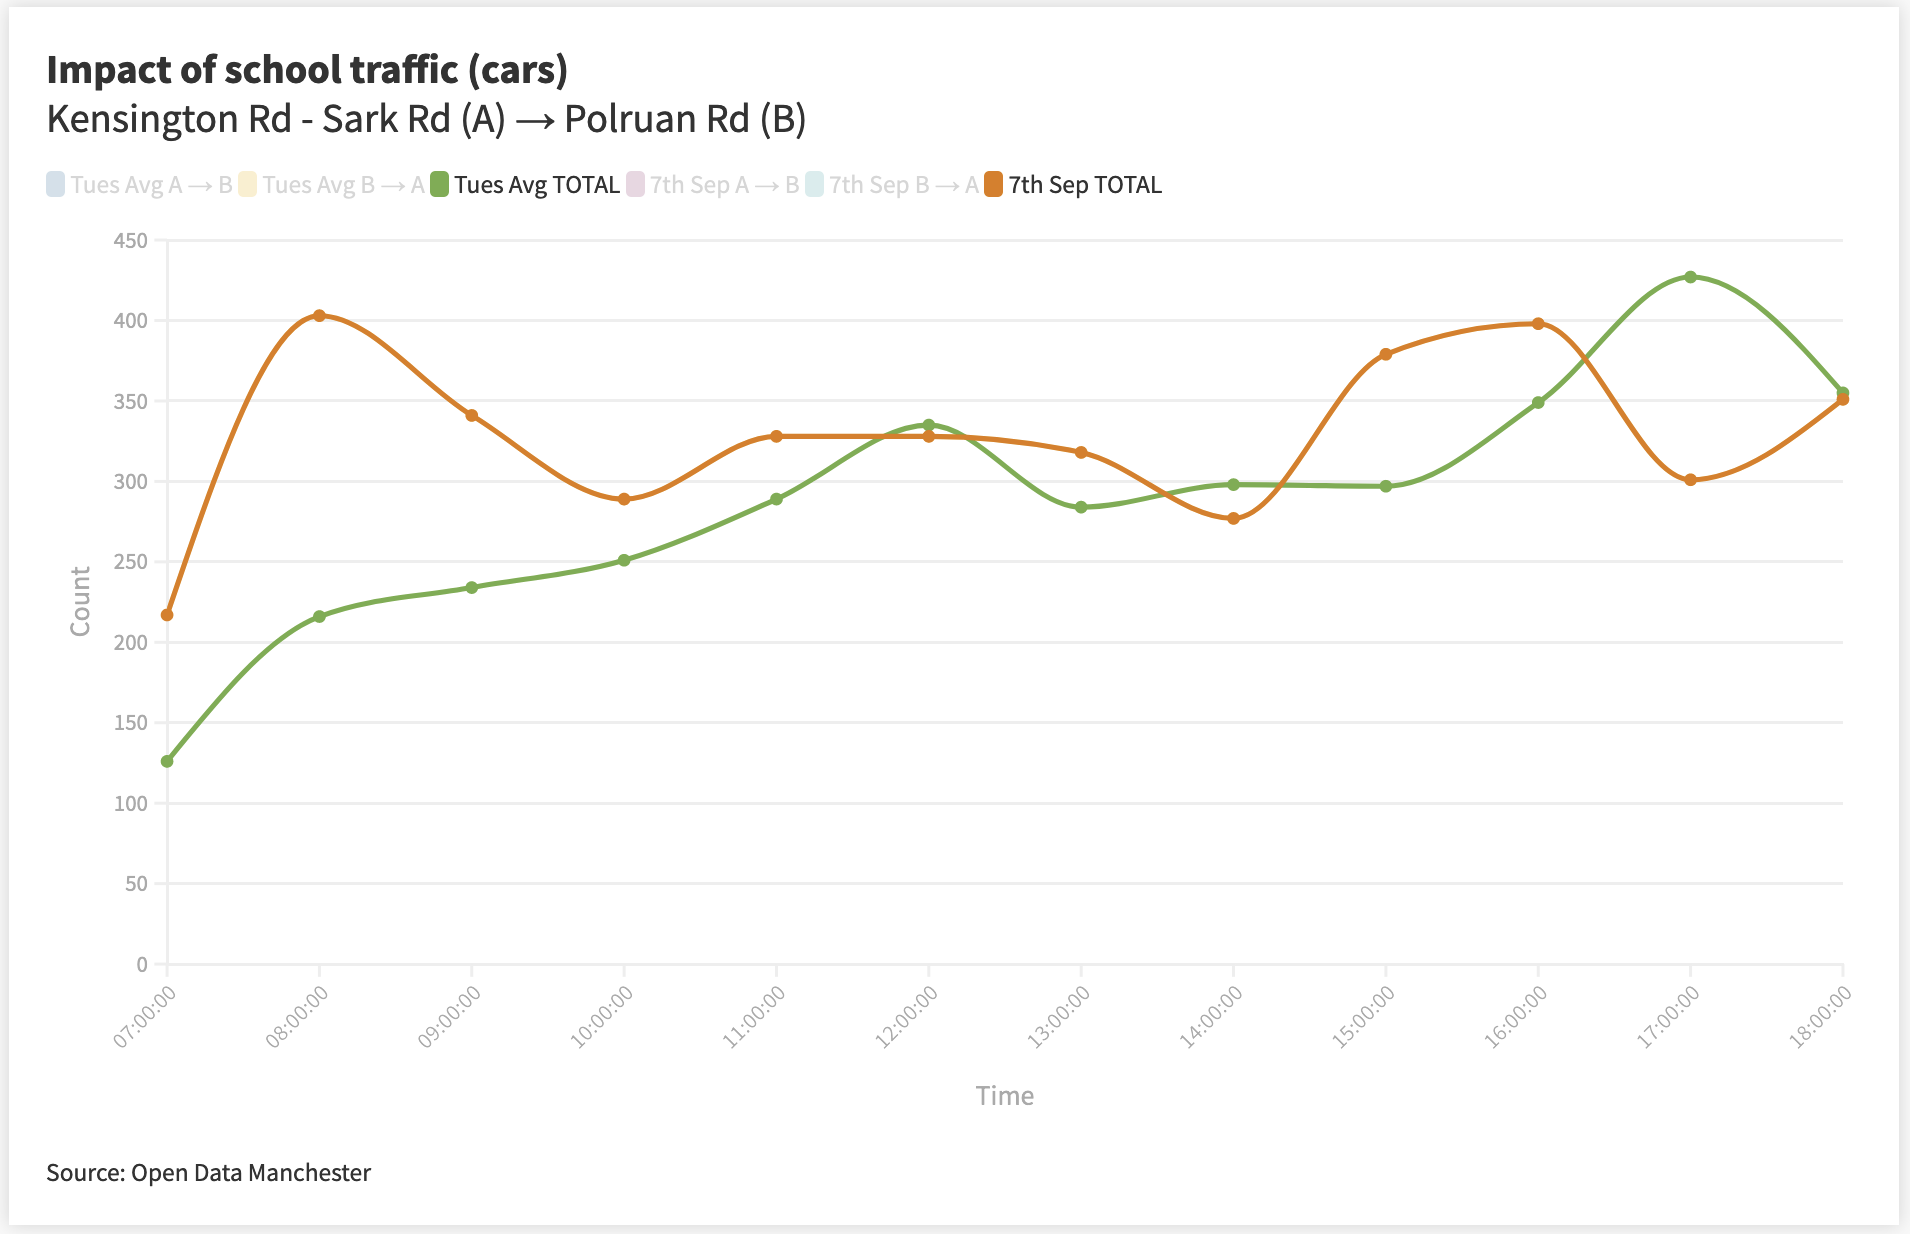
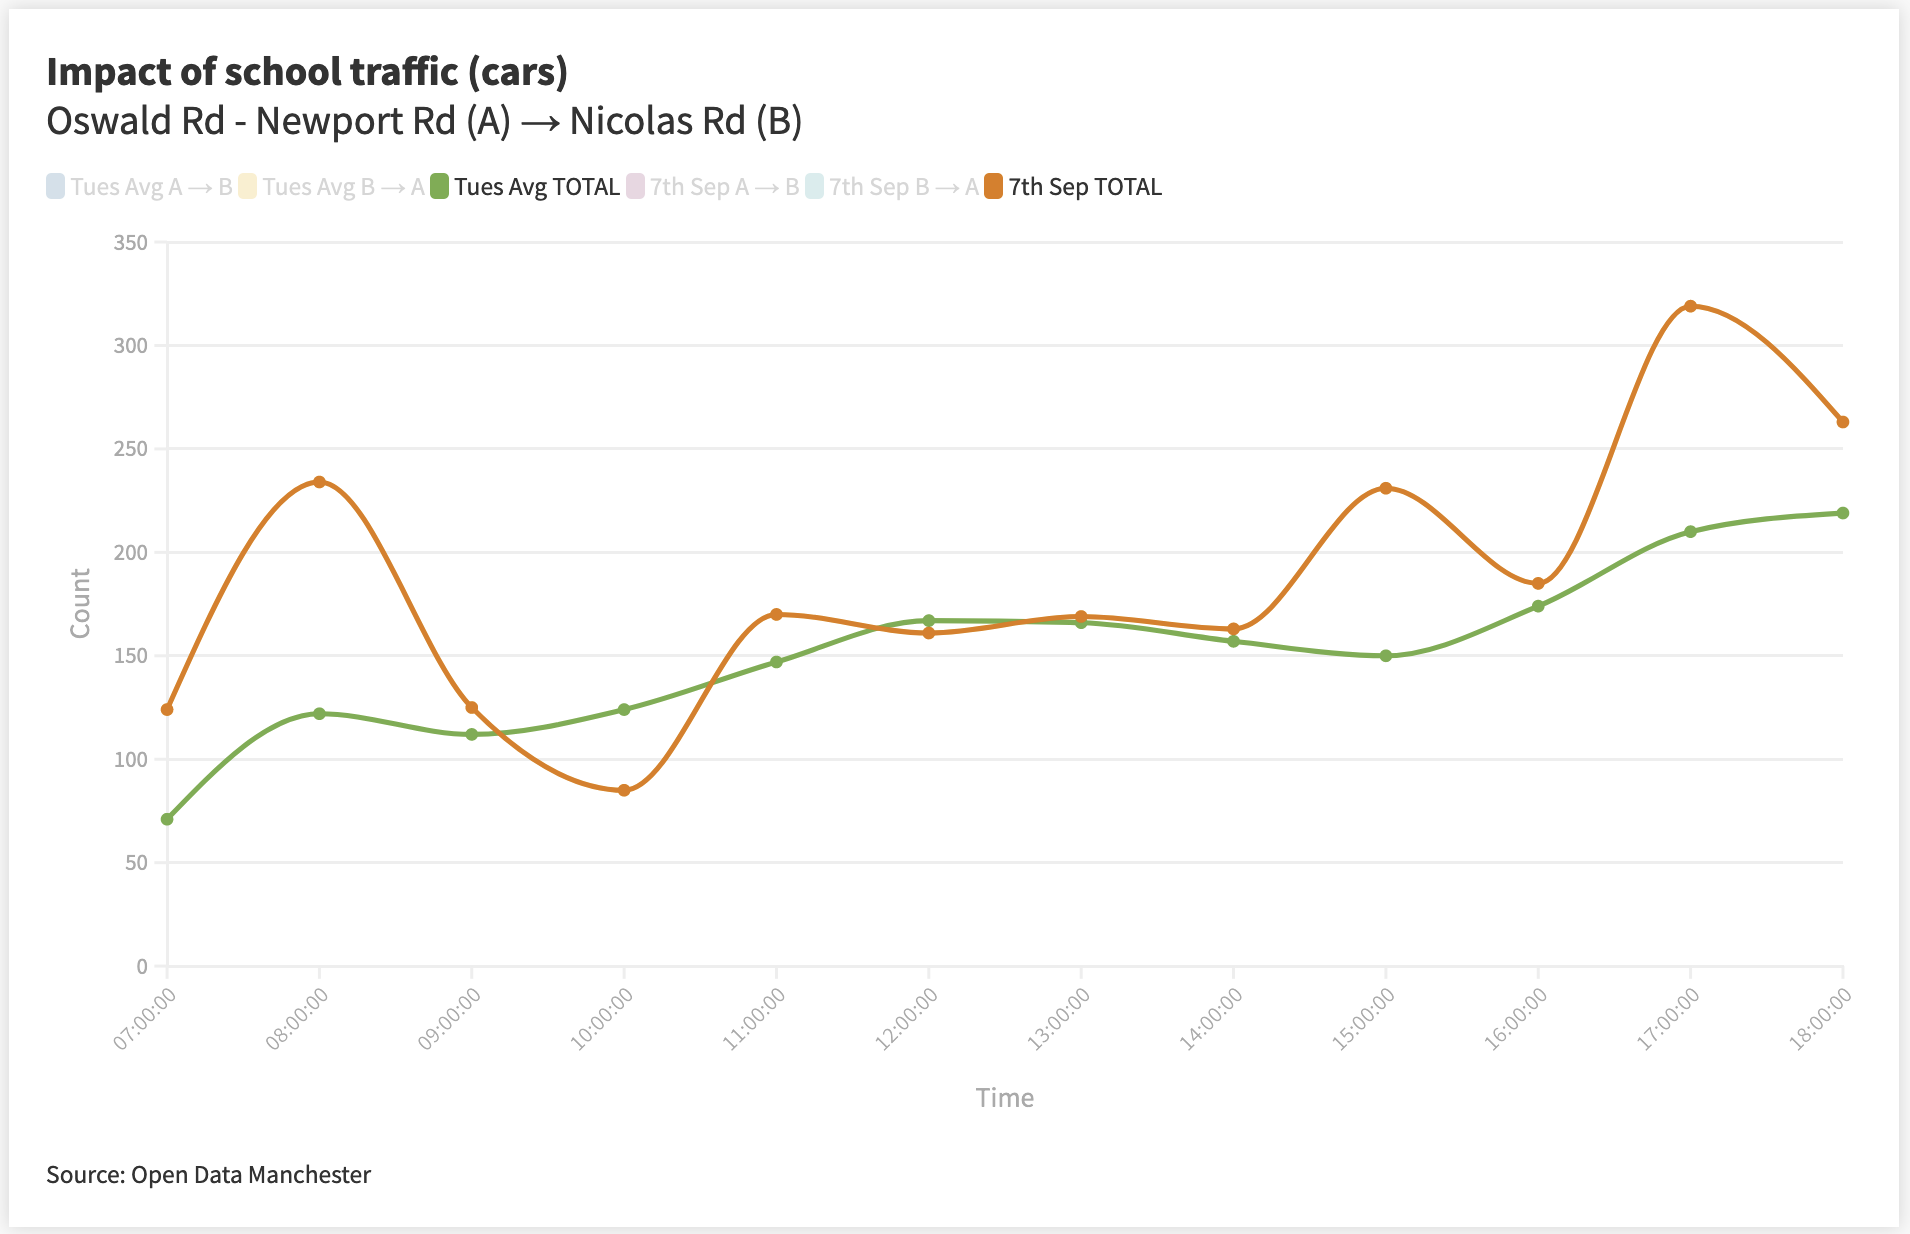
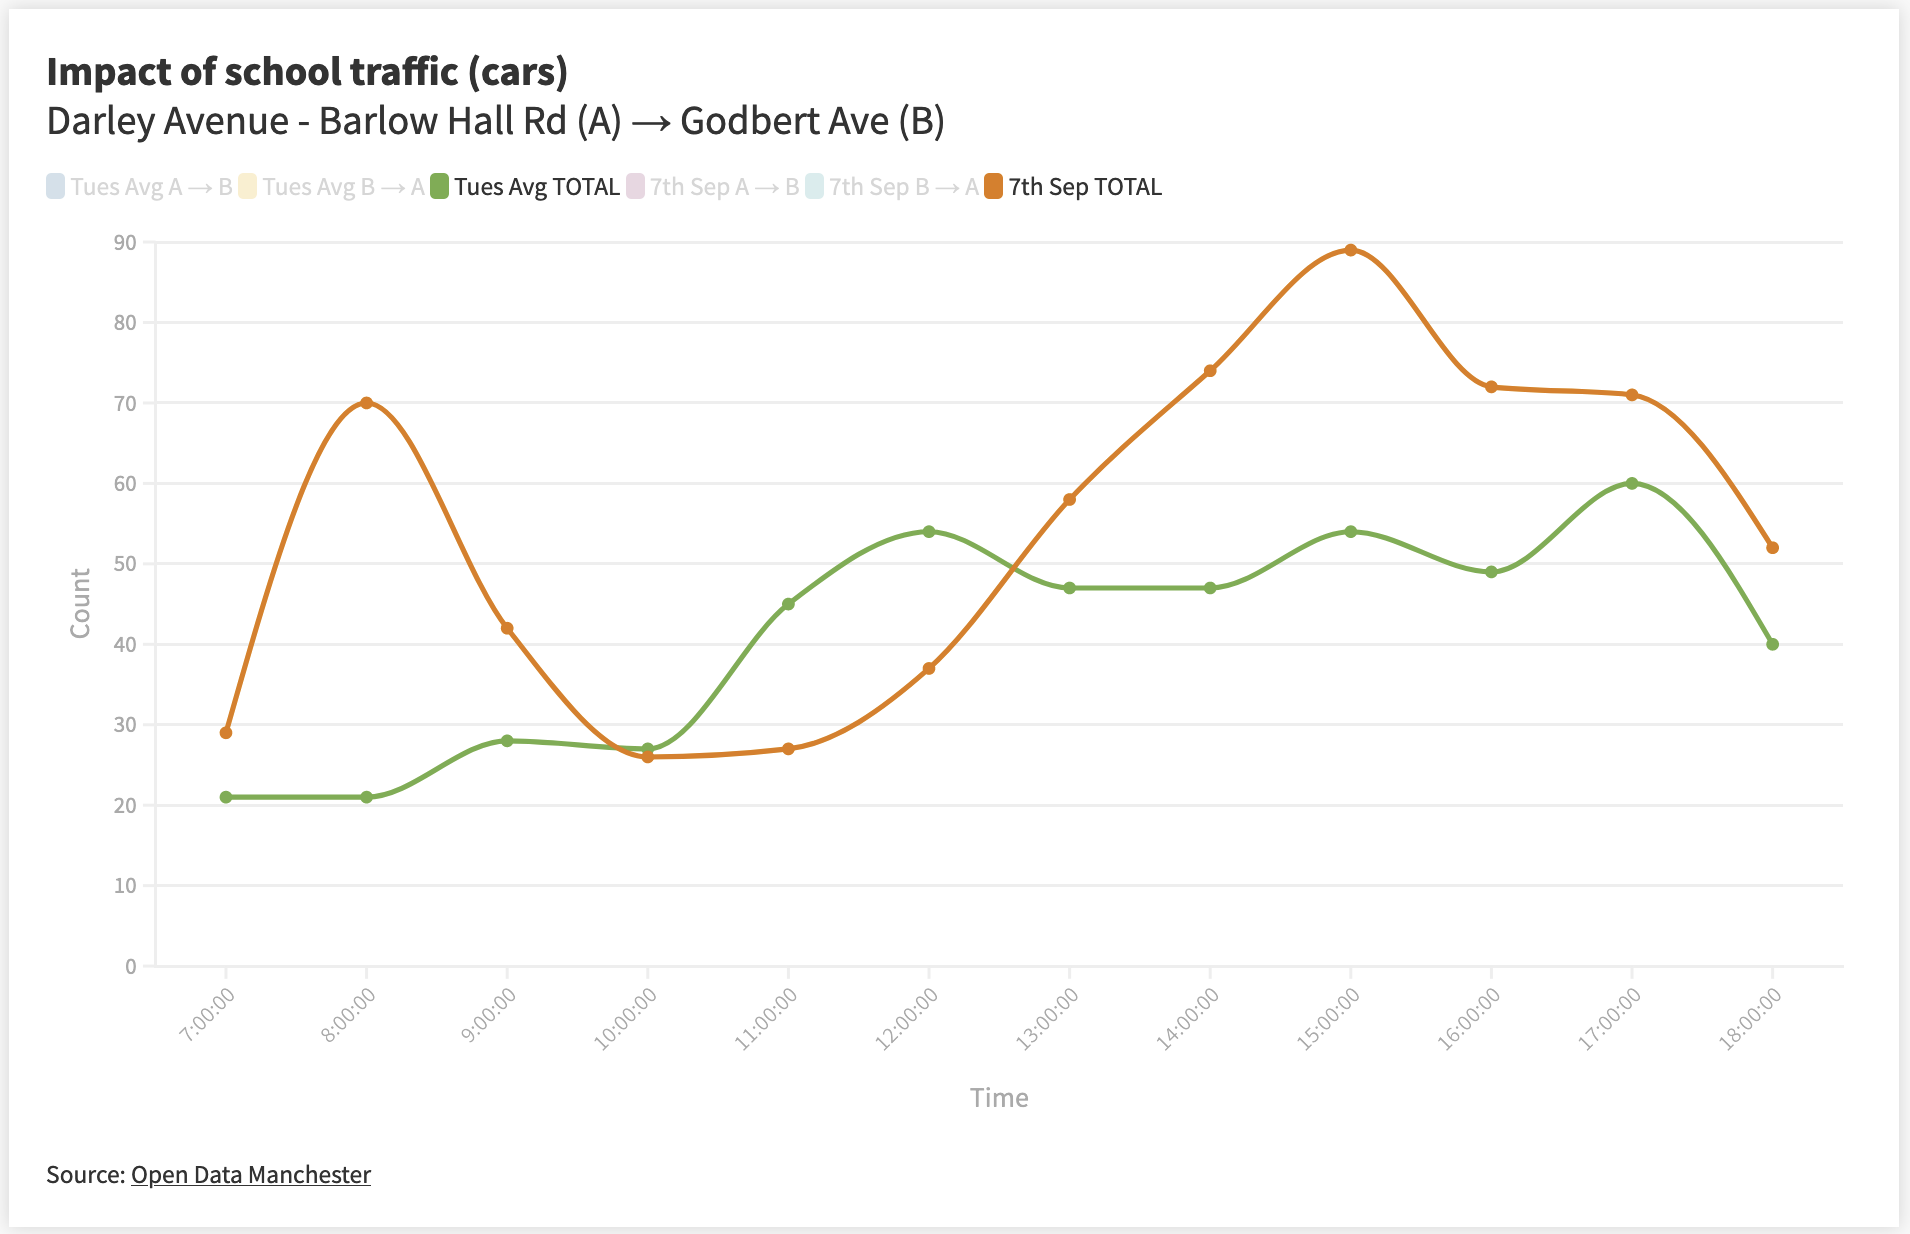
At all four locations, we can see that there is a noticeable difference in traffic between the August baseline and 7 September 2021.
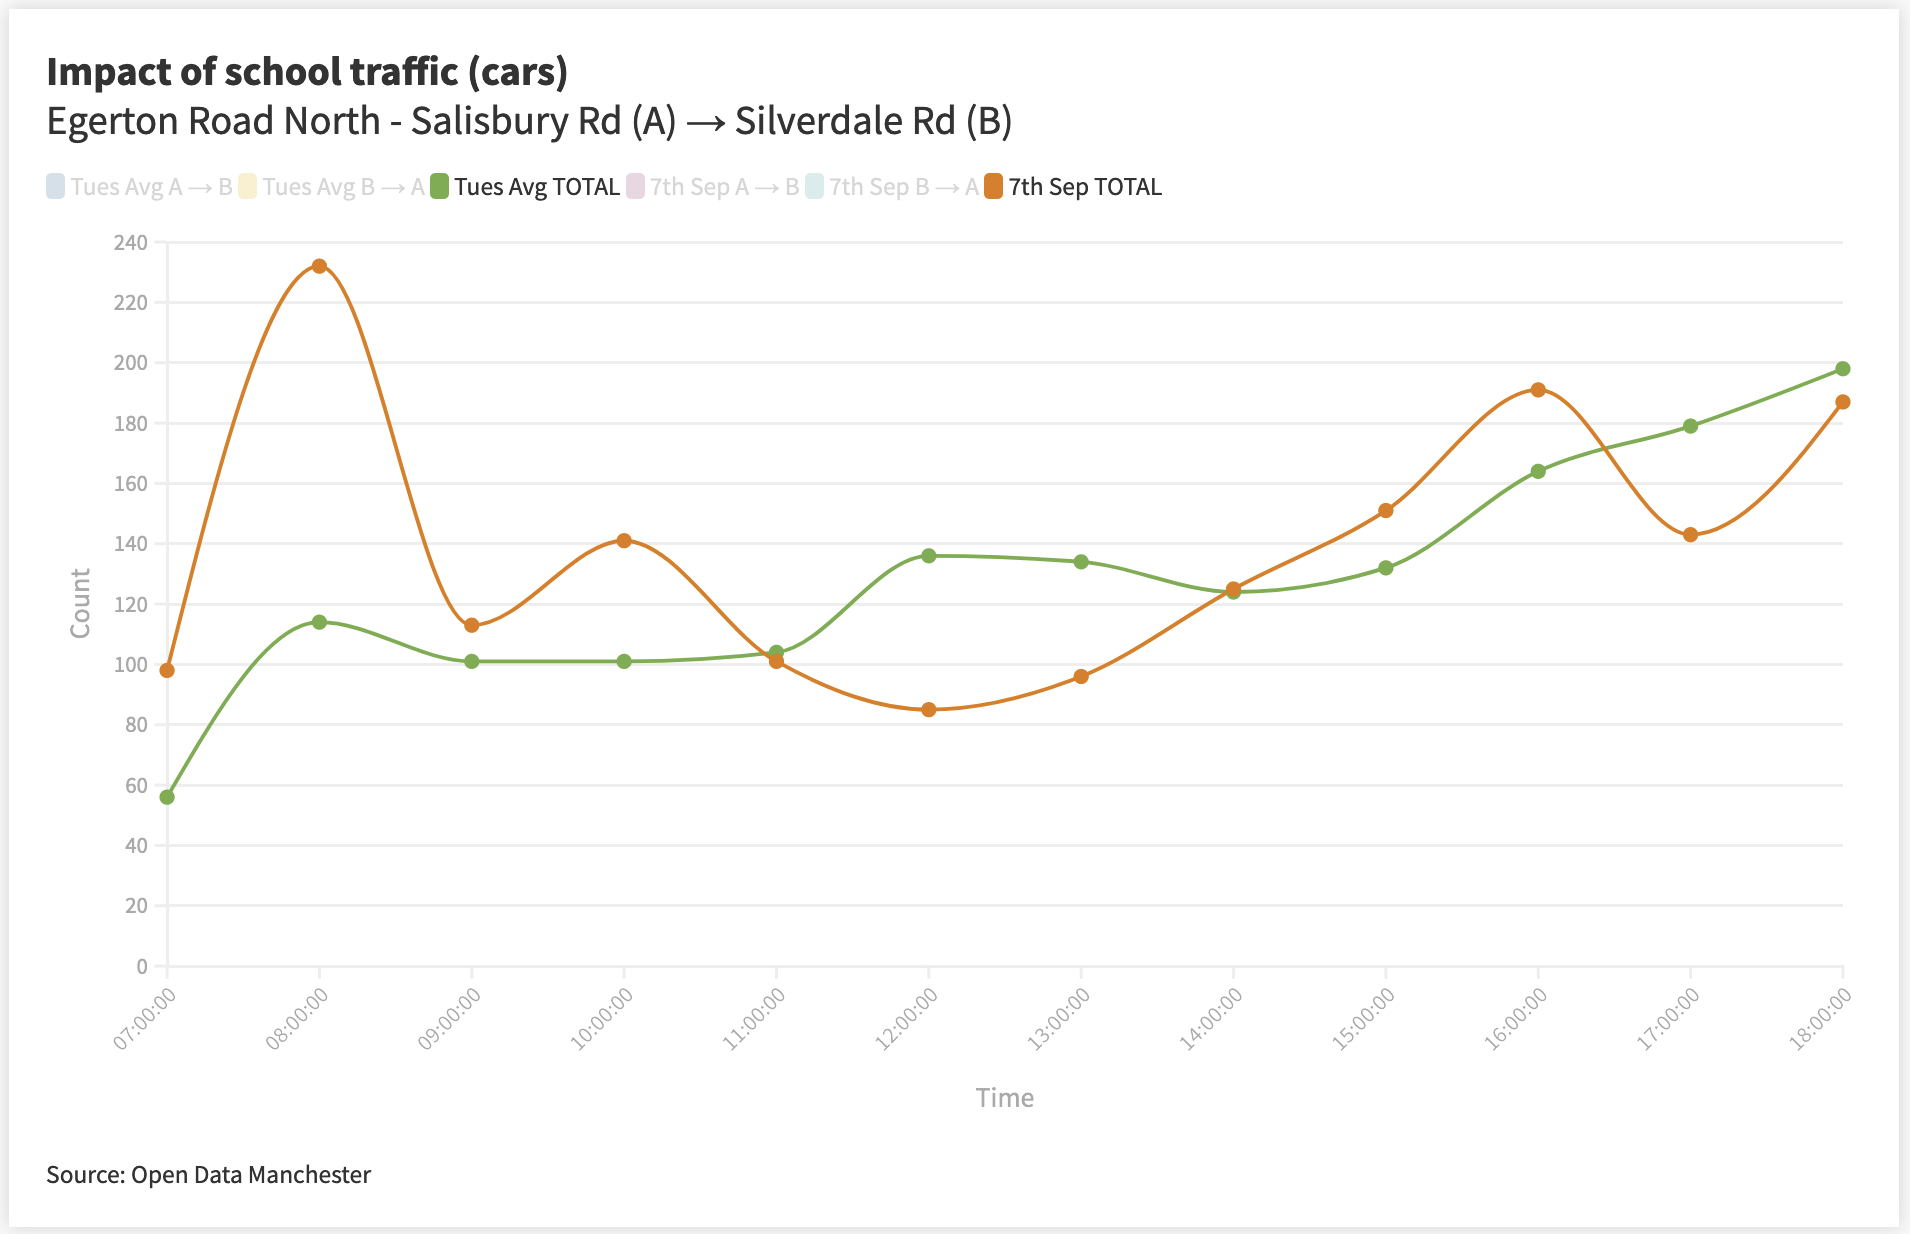
There are peaks in traffic at 8am to 9am and 3pm to 5pm, which matches the school-run time. We can see that the afternoon peak is longer than in the morning, and in some locations, such as Egerton Road North, we see a much higher morning peak than in the afternoon. This is likely due to people travelling to work in the morning at the same time as the school run, but perhaps returning later in the evening.
Both Darley Avenue and Oswald Road are streets with schools on them, so it is unsurprising to see a marked difference, but we also see the same patterns on both Kensington Road and Egerton Road North. These two are not school streets, but Kensington Road intersects with Oswald Road, and Egerton Road North has a number of schools nearby, so it is not surprising to see such an effect at these locations and times.
Comparing all locations
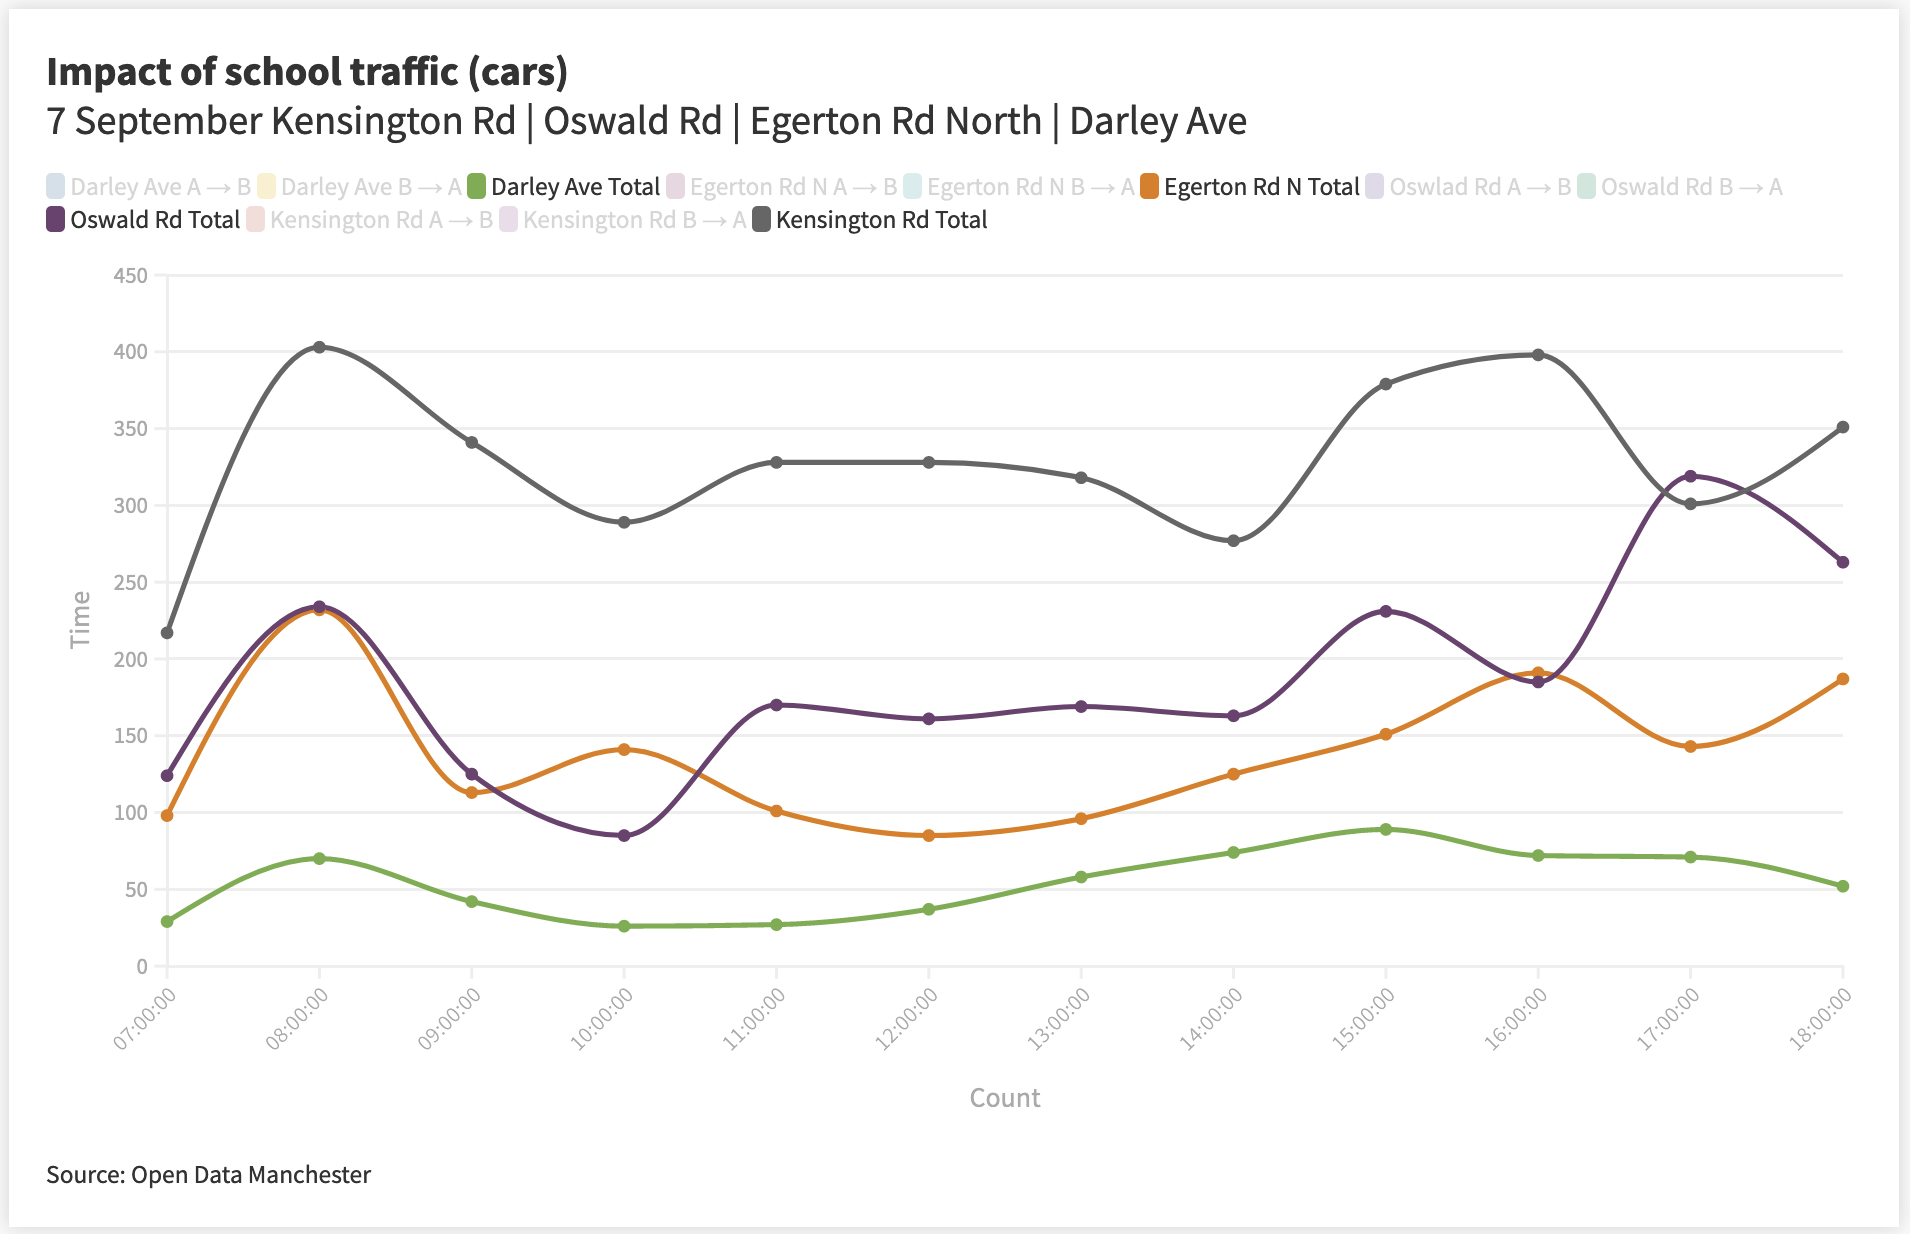
The graph above shows all of our data from 7 September 2021. We can see all four locations affected by the school run during 8am to 9am and 3 to 5pm. Despite Darley Avenue having a school located on it, it is clearly less busy than the others. Again, this is likely because the other three are main through roads, and lead to multiple school areas, while Darley Avenue is in a much quieter residential area.
One interesting thing to note is that the data for Oswald Road shows a dip in traffic between 4pm to 5pm, then another peak from 5pm to 6pm, whereas the other locations tend to peak during this time and drop off at 5pm to 6pm.
Conclusion
By exploring the data from the Telraam units, which are hosted by residents of Chorlton and Chorlton Park, we were able to demonstrate a change in the flow of traffic on Saturdays when there is a football match being played at Old Trafford stadium, and again during the school run.
Our Telraam network is rather small at present and, because the locations of the units are based on volunteers coming forward to host them, we haven’t chosen the locations for being ‘interesting’ or ‘efficient’ monitoring sites – yet – we are still able to see some interesting patterns.
In this analysis, we only look at total traffic – and a deeper dive into something like the direction of traffic could pose further questions – such as, why does the traffic on Kensington Road seem to increase in the direction heading away from Old Trafford on match days?
If you want to explore some of the graphs or data yourself, you can do so using the links below.
Impact of Manchester United traffic:
Impact of school traffic:
All other data can be found on Telraam.net (simply navigate on the map to Chorlton).
Feel free to share any thoughts, findings, or questions over on the Open Data Manchester forum, send us a tweet or drop us an email.
For more information on Our Streets Chorlton and how to get involved, visit the website or follow them on Twitter.