
In 2010, we published an article asking “why open data”. Back then, open data was still a relatively new idea. A small number of cities had started publishing transport feeds, spending data and service information online. There was a growing belief that making data accessible could strengthen democracy, improve public services and help people participate
03
Jun
Jun
Open Data Manchester has submitted four responses to the UK’s National Action Plan (NAP7) consultation, exploring how openness, accountability and participation can keep pace with changes in public service delivery, infrastructure and digital government. The way public services are delivered, infrastructure is managed and decisions are made is changing rapidly. Increasingly, these processes are shaped
25
Apr
Apr
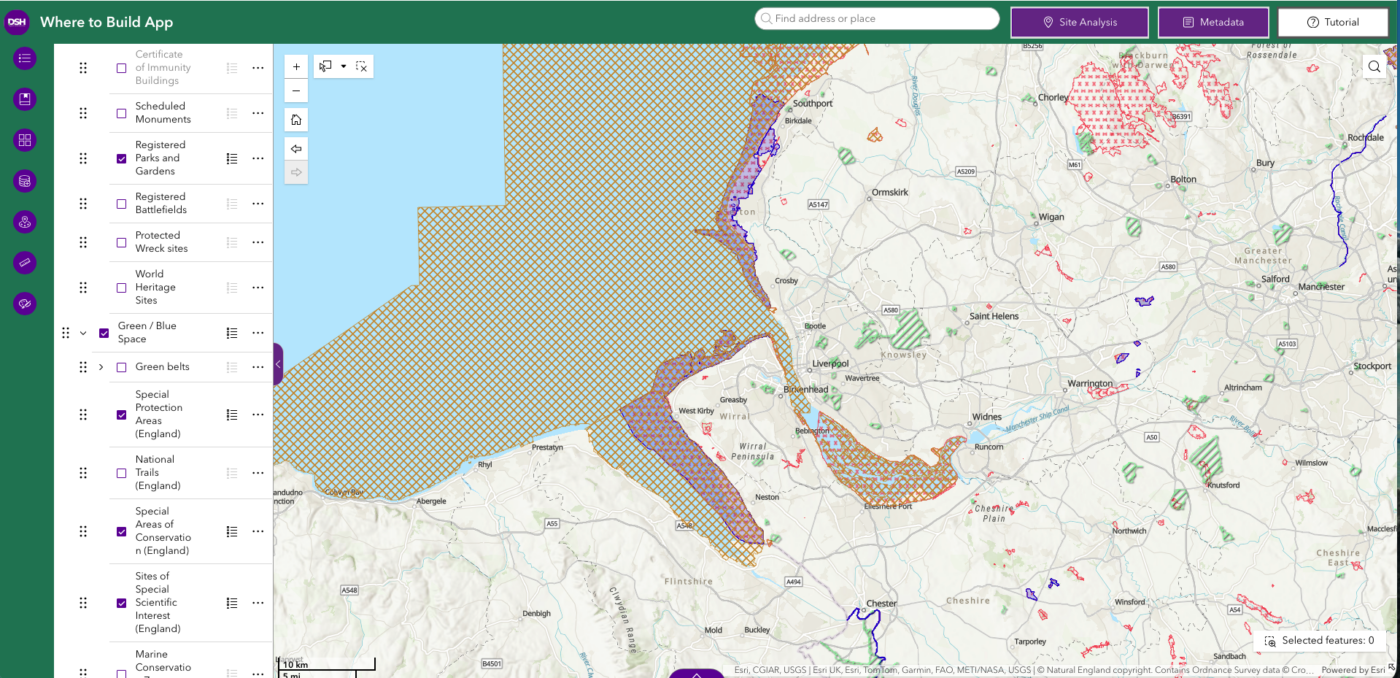
We are not short of data. There is more information than ever about climate, health, and our communities. But making sense of it, and actually using it, is still surprisingly difficult. Data sits in different places, in different formats, owned by different organisations. Even when you can find it, connecting it to real decisions is

31
Mar
Mar
Data has traditionally been used as a tool of management and control. Nowhere is this more visible than in the measurement of deprivation. The Index of Multiple Deprivation (IMD) is one of the most consequential datasets in England. It shapes billions of pounds of public and private investment. It informs decisions in education, healthcare, insurance
25
Mar
Mar
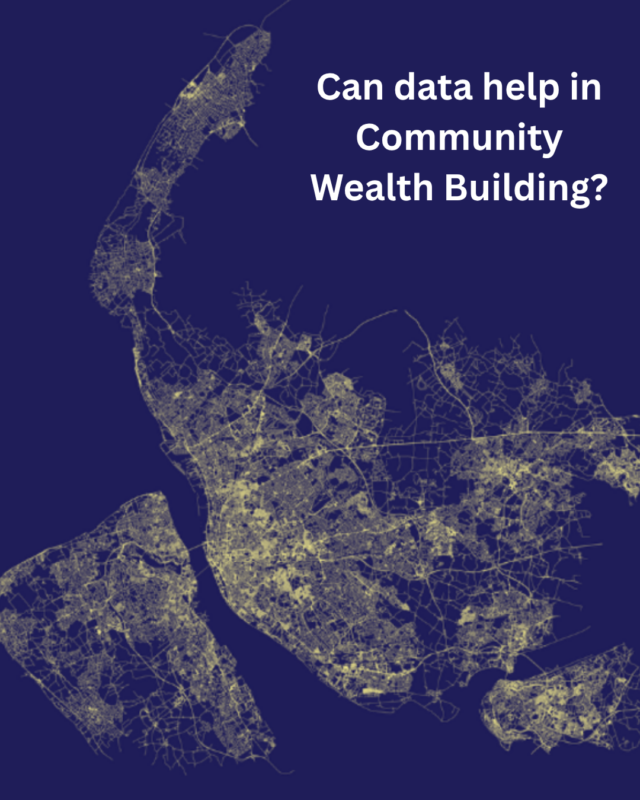
What happens when we start to see how money really moves through our communities? Local economies are under pressure. Budgets are tight, inequality is rising, and yet huge amounts of money still flow through our places every day. The problem is, we do not have a clear view of where that money goes or what
25
Feb
Feb
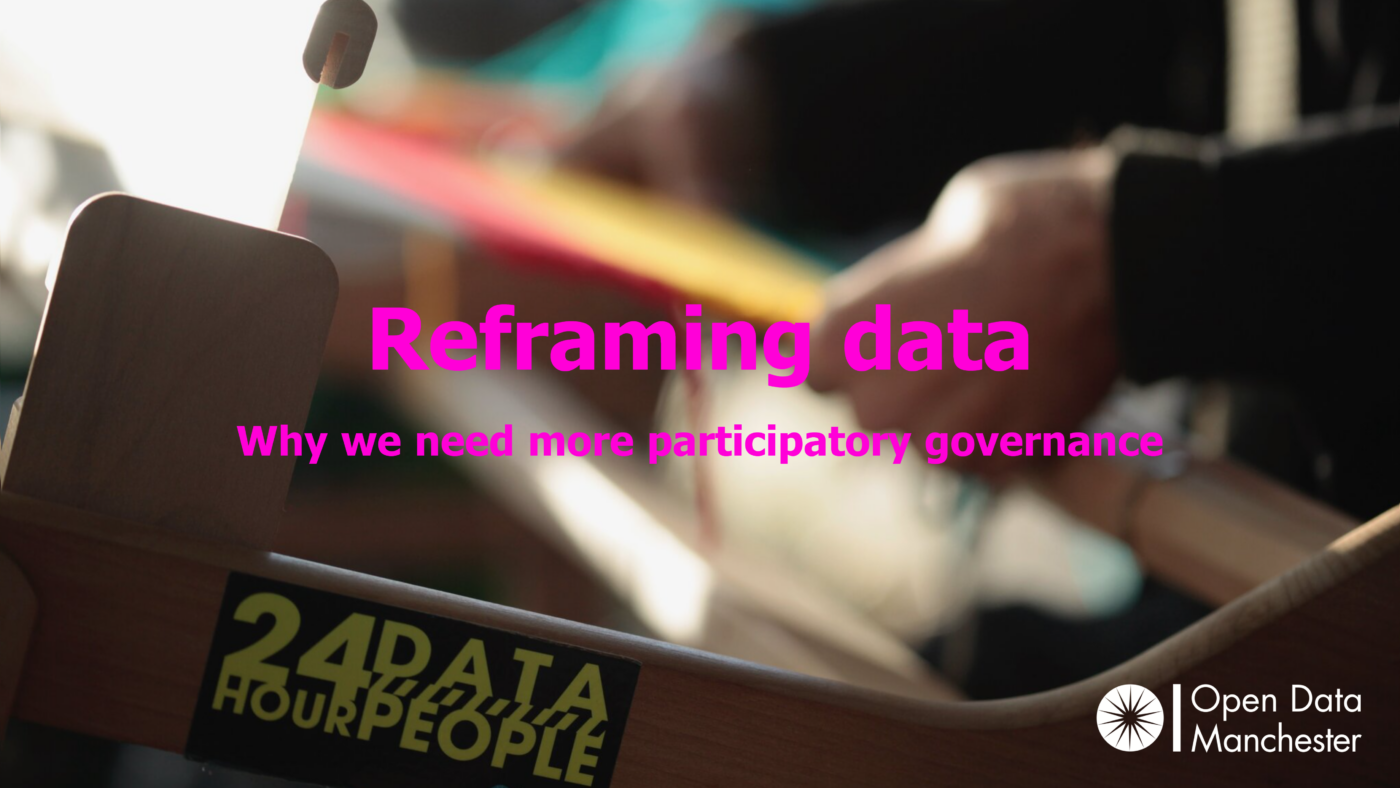
Data has traditionally been used as a tool of management and control. In cities especially, data determines how things work, where intervention should happen and how impact should be measured. It feeds dashboards, targets and performance frameworks. Implicit in this approach is the belief that places can be defined, understood and improved through better measurement.
07
Dec
Dec
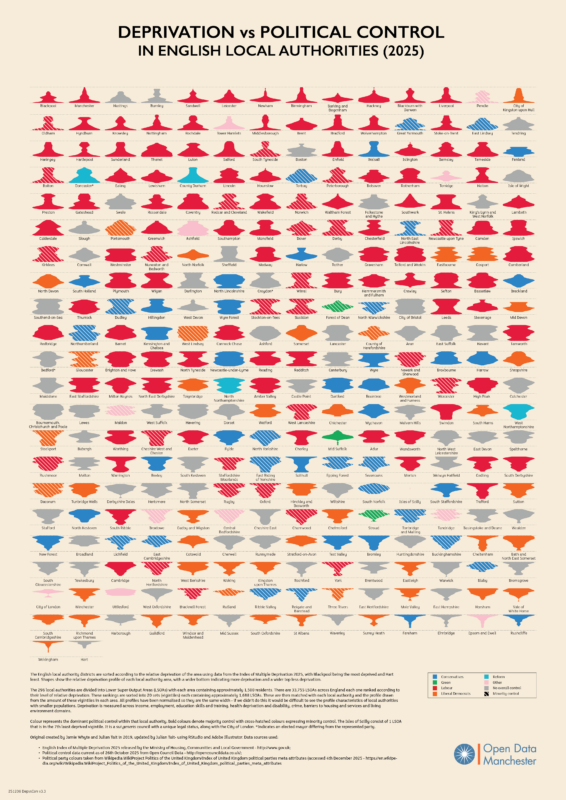
You may have noticed that the Indices of Deprivation for England were updated and released in November 2025, and this has given us an opportunity to revisit a project that was initiated by Jamie Whyte back in 2018—visualising the relationship between deprivation and political control in English local authorities. The Index of Multiple Deprivation (IMD)
31
Oct
Oct
The last two years have been challenging for civil society organisations across the UK. Like many not-for-profits, we’ve watched respected organisations close their doors as funding landscapes shifted dramatically—grant funding reduced, philanthropic support became harder to access, and many traditional income streams simply dried up. Open Data Manchester hasn’t been immune to these pressures. We
30
Oct
Oct
Over the past few months, we’ve been developing new AI literacy resources as part of our Data For Communities programme. Our aim is to create workshops that help people understand what AI can and can’t do, gain hands-on experience, and making their own informed choices about choosing to using it, or choosing not to. Drawing

19
Oct
Oct
Last month I was lucky to attend at csv,conf,v9 in Bologna, where I gave a talk on our Data For Communities programme. A gathering of the community data world, it was great to connect with people doing similar work from all over the globe and reminded me by this work matters. Finding data in the